


- Rainwater treatment using porous geopolymer modified with IGCC slag and Si sludge
Yootaek Kim* and Taesung Chae
Department of Materials Engineering, Kyonggi University, Suwon 16227, Korea
This study was conducted to obtain basic data to evaluate the applicability of geopolymers as absorbers for suspended solids (SS) in rainwater. Geopolymer absorbers were prepared by integrated gasification combined cycle fused slag and Si sludge. The SS removal percentages were determined and compared on the basis of the porosity, size, and density of the absorbers. The maximum SS removal percentage of the geopolymer absorber with a density of 0.9 g/cm3 and pore sizes ranging from ~123 to 909 μm was 91.0%, which meets the standard value for commercial absorbers in Korea. Although the geopolymer absorbers had low densities and large pore sizes, the SS removal percentage did not increase as the density decreased; this is because of the resulting low compressive strength and high fracture rate, which typically leads to the formation of small particles and increases SS concentration in rainwater.
Keywords: Geopolymer absorber, IGCC fused slag, Si sludge, SS removal percentage
Generally, there are point sources, such as sewage and wastewater from homes, and non-point sources, such as pollutants from forests, agricultural fields, eroded roads, and livestock excretion, that act as pollution sources for river basins [1]. Particularly, eutrophication due to non-point sources such as forests, agricultural fields, and livestock excretion causes serious environmental problems. In general, the inflow rate of phosphorus sources increases as a result of the loss of soil because the phosphorus sources are carried by soil, which originates in forests, as a consequence of the heavy rainfall occurring the long rainy season in Korea. Under the conditions of an intense rainy season, such as that observed in Korea, the inflow of phosphor is substantially increased because surface soil and livestock excretion containing phosphor simultaneously flow into rivers within a short period of time [2].
In 2008, the upper limits of the biochemical oxygen demand (BOD) and suspended solids (SS) were set as 10 mg/L, and the total nitrogen limit was reduced to 2 mg/L from 4 mg/L for volumes lower than 50 m3. Because continuous monitoring and controlling systems, such as telemetry monitoring systems, can significantly burden field environmental control personnel, thereby making their work difficult, it is necessary to develop an automatic artificially intelligent control and operating system for rain and sewage treatment to control organic material, nitrogen, phosphor, and SS contents [3].
SS can be defined as inorganic and organic materials in water, and consist of particles ranging between ~0.1 and 2000 μm in diameter that can be separated via centrifugation or filtration. SS are also defined as the residues that remain after drying at ~105–110 oC according to the ASTM standard describing the test method and process for water quality estimation of polluted water [4]. As a non-point pollution source, SS induce water turbidity, reduce dissolved oxygen content, generate sediment, and act as a source of harmful gases, such as H2S and CH4. In water quality management, the removal of SS is considered to be as important as eliminating the BOD [5].
In 2010, the daily BOD and total phosphorus (T-P) fractions of the non-point sources in all water pollutant materials in Korea were 68.3% and 58.9%, respectively. The load of non-point sources is typically higher than that of point sources in the four biggest river areas in Korea [6]. In general, there are many methods for SS removal, such as the use of coagulating materials, chelating materials, reverse osmotic pressure, and ion exchange [7].
Therefore, in this study, geopolymer absorbers were prepared for the treatment of non-point-source pollutants by using integrated gasification combined cycle (IGCC) slag from the Taean West Power Plant, and Si sludge produced during the polishing process of Si wafers; these waste materials were selected because more efficient rain treatment materials have been requested by the manufacturers, and because industrial waste recycling has become a globally important matter. The commercial applicability of the geopolymer absorbers to the process of SS removal was determined, and basic data for this process were obtained through this study.
Preparation of filter media
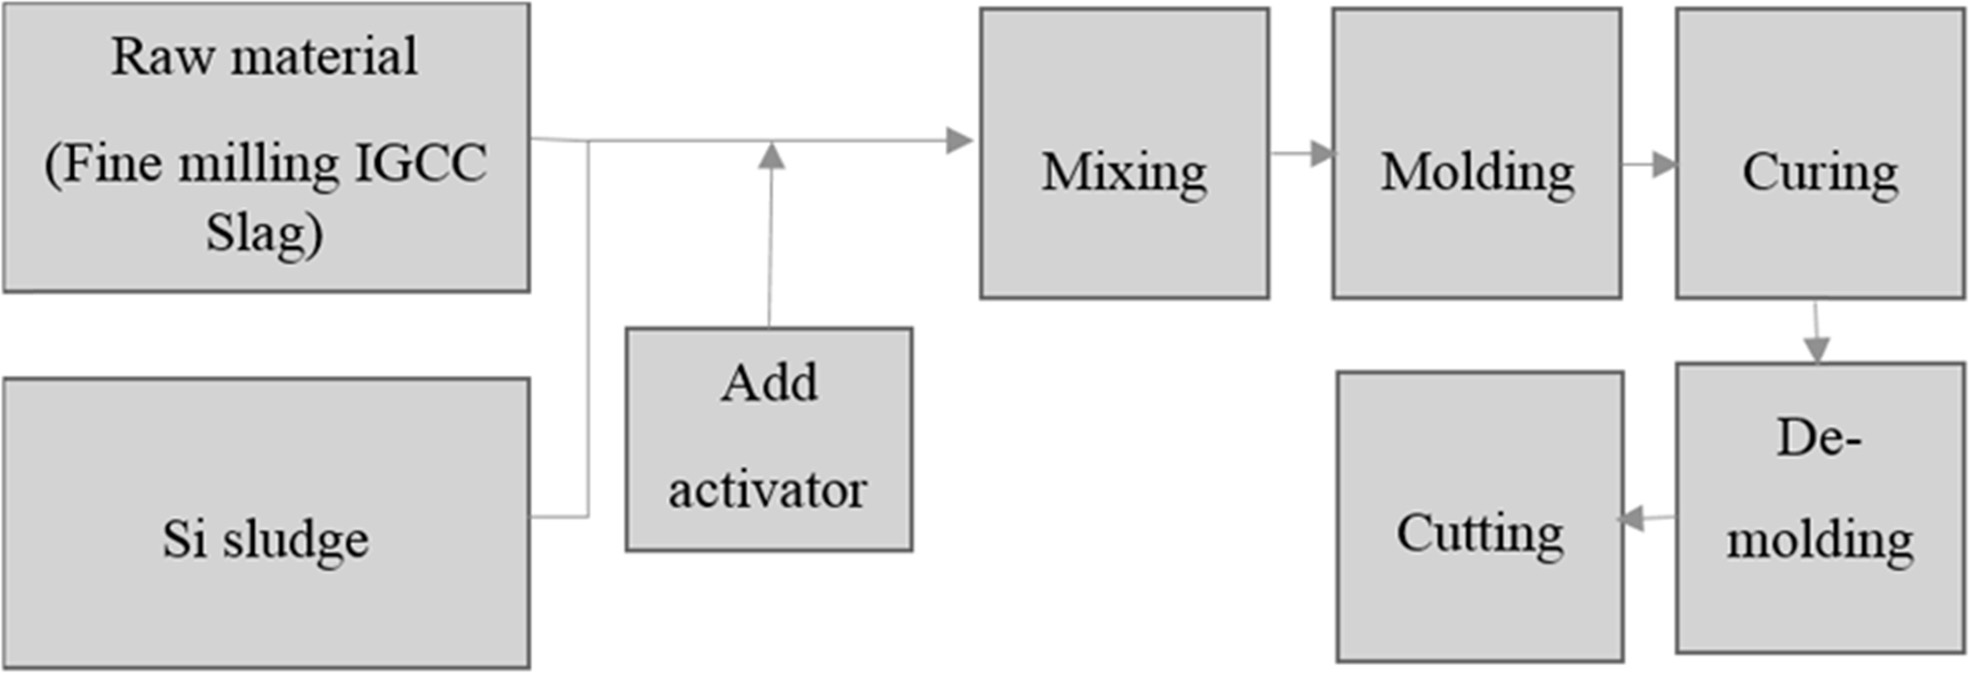
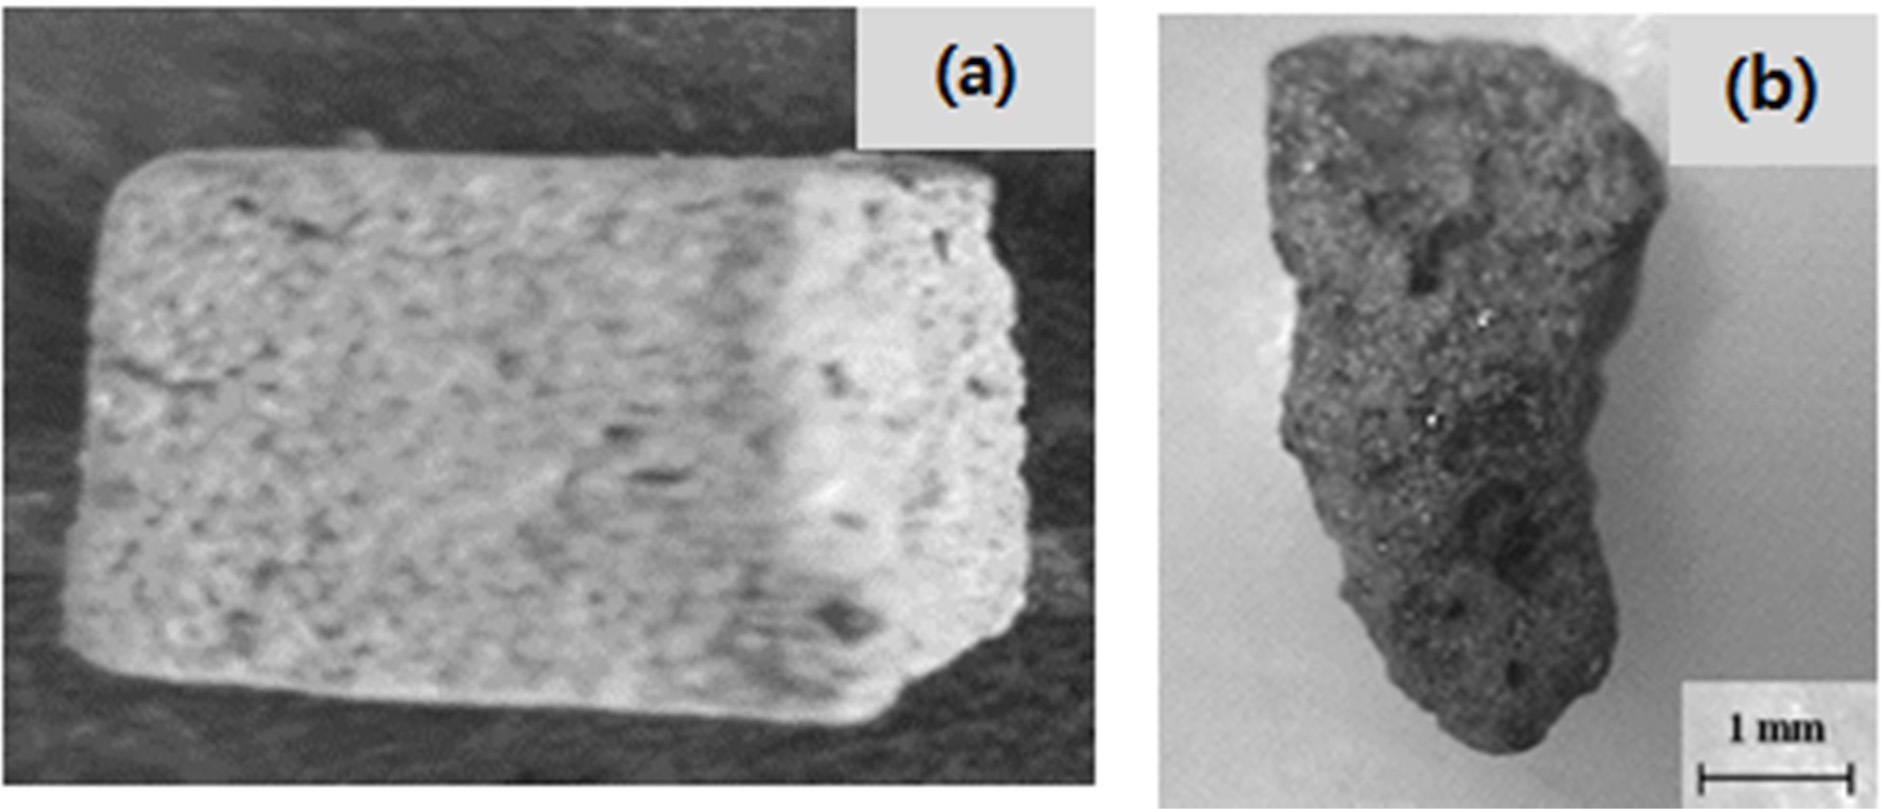
The procedure for making geopolymer absorbers is shown in Fig. 1. According to earlier research, IGCC slag does not exhibit sufficient plasticity. Therefore, geopolymer absorbers were manually produced, i.e., not by using an extruding method; the content of water was a critical factor in the preparation of the geopolymer specimens. The conditions for preparing the geopolymer absorbers were as follows: a water/solid (W/S) ratio of 0.6, and 9 M of an alkaline activator mixture. Fig. 1(a) and (b) respectively show images of a geopolymer absorber made in the laboratory, and a commercial clay base absorber.
Preparation of influent water
In this study, inlet water containing naturally accumulated roadside clay and dust was prepared according to the Manual for the Installation, Management and Operations of an Apparatus for the Reduction of Pollutants Sourced from Rainfall for the simulation of pollutant inflow into the pollutant reduction apparatus. The size ratios for the SS in the inflowing water are shown in Table 1. Inflow water with a concentration between ~180 and 230 mg/L was prepared by mixing 0.8 g of solids smaller than 63 µm in size, and 0.2 g of solids between ~63 and 200 µm in size, with 4 L of water; the equation for calculating the concentration of the inflow water is as shown in eq. (1).
Total weight (mg) of suspended solids/L
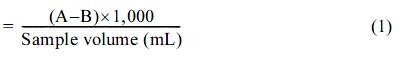
A = Weight of filter + dried residue in mg
B = Weight of filter in mg
Device for measuring the suspended-solid removal percentage
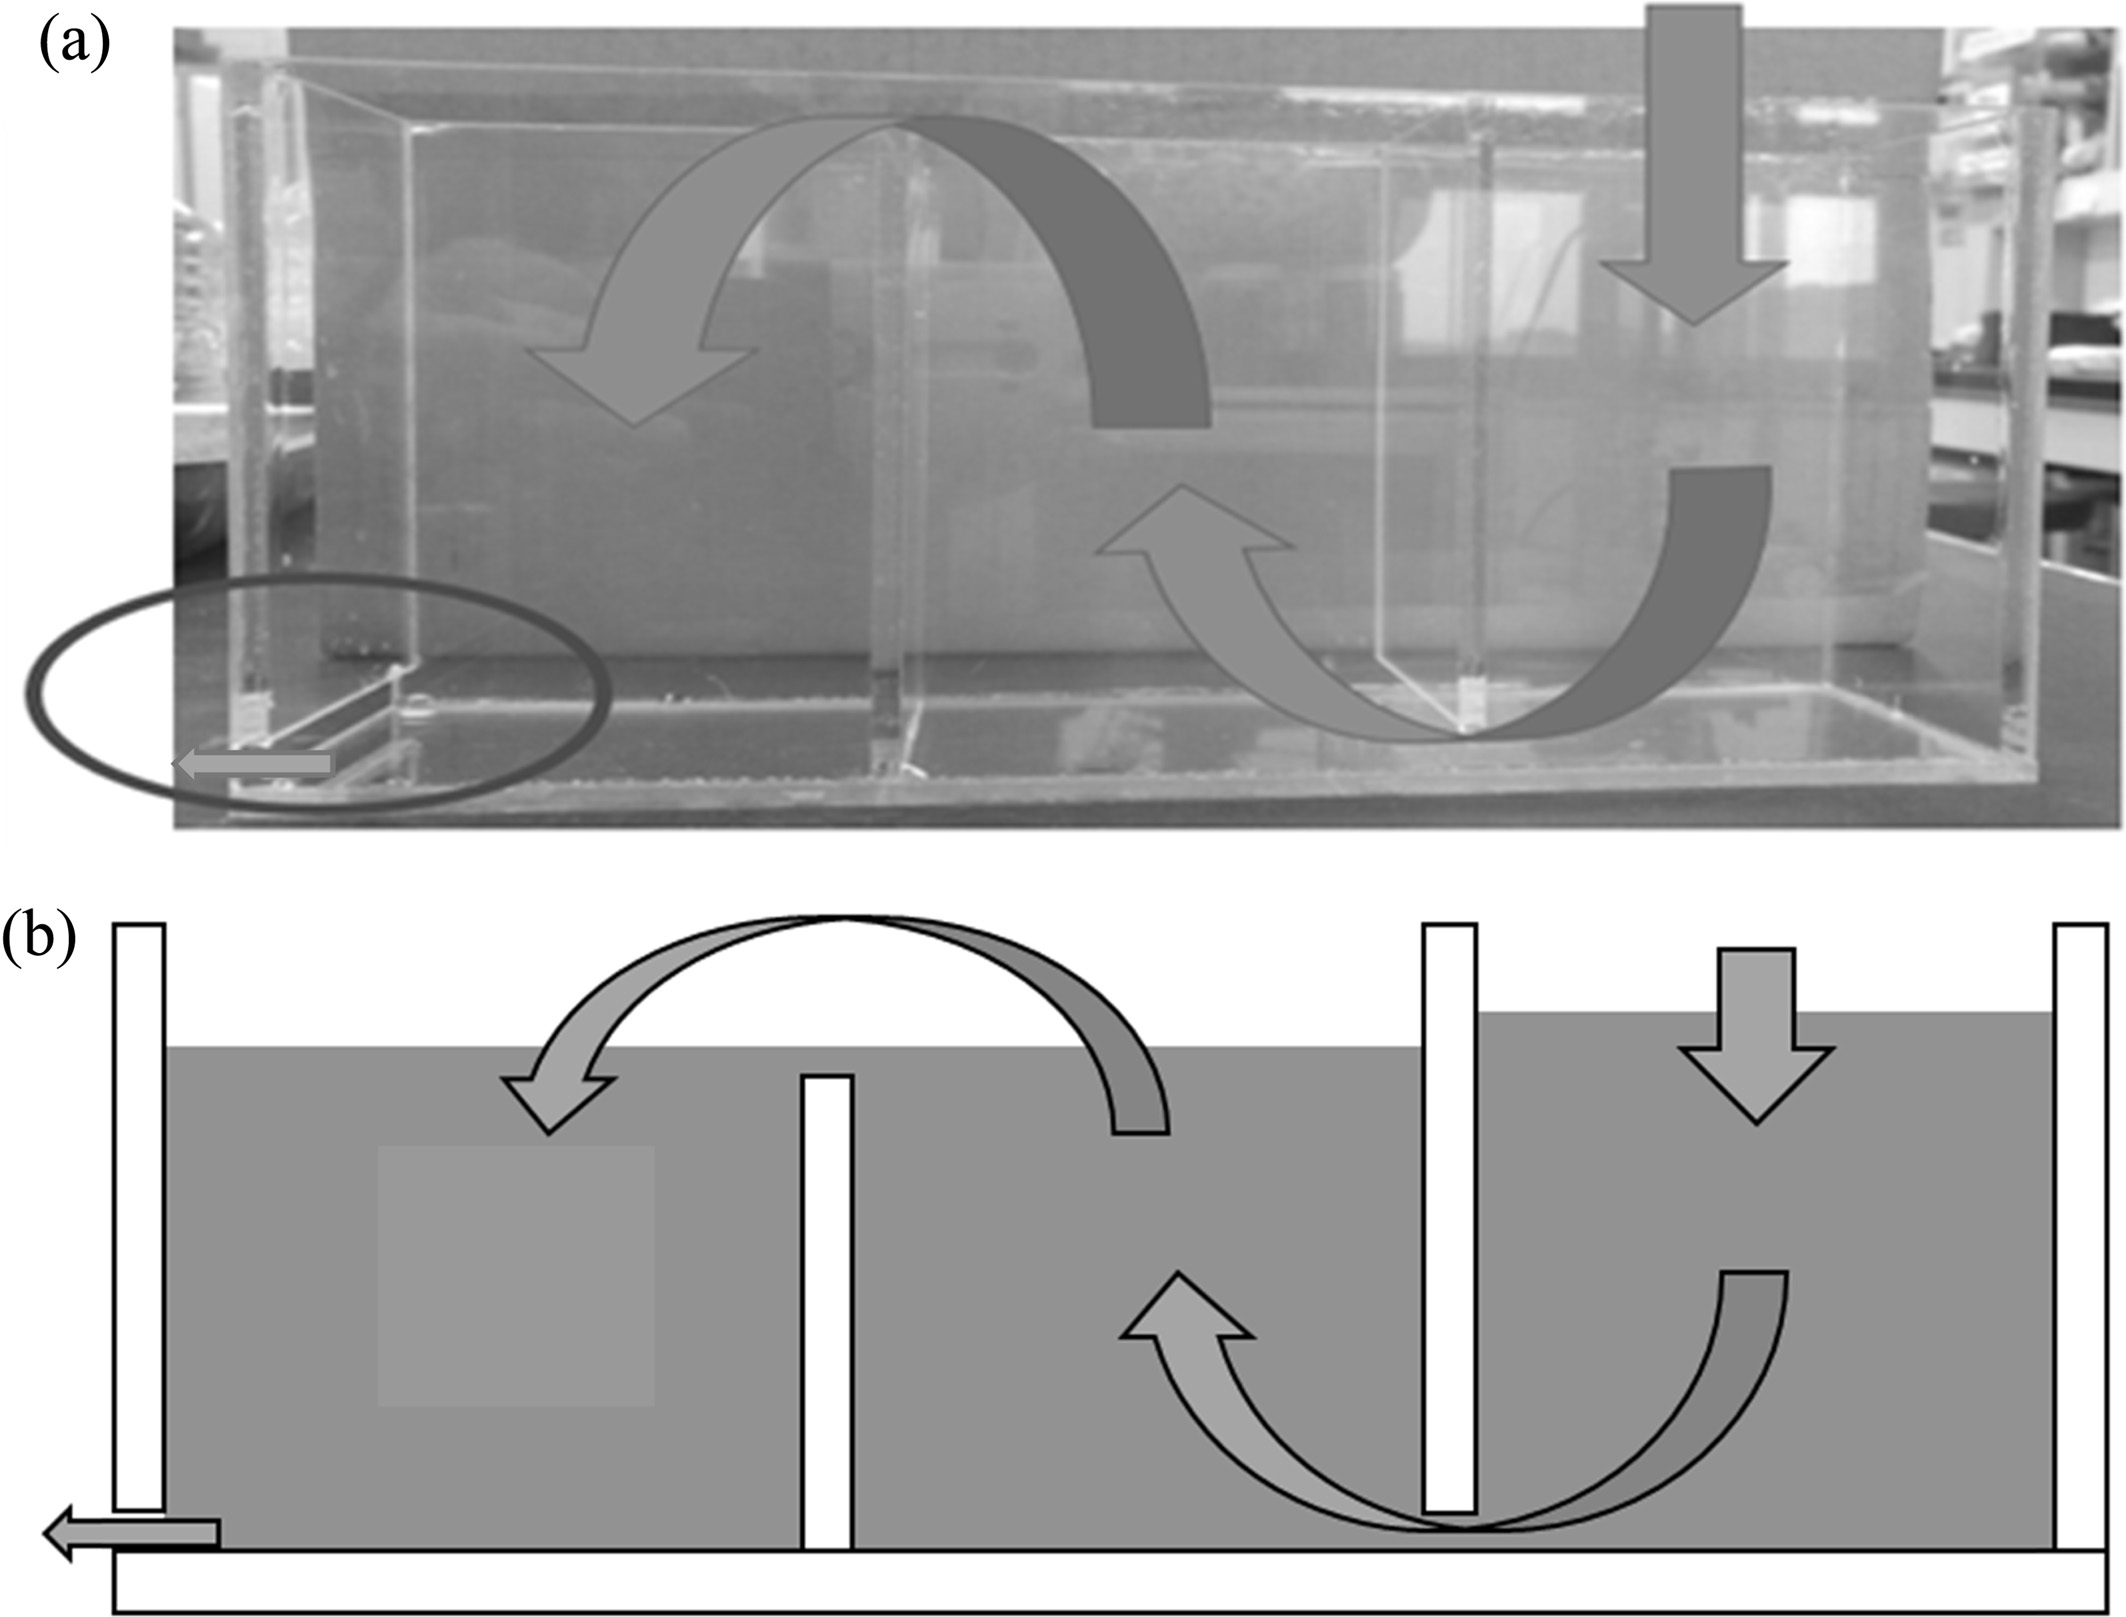
Because the approved apparatus for measuring the SS removal percentage is large-scale in practice, a small-sized test apparatus was designed and manufactured in this study to simplify the experiments and make flow suspension as similar as possible to that implemented in industry. Fig. 3 shows a photograph and schematic diagram of the laboratory-designed device, which has three compartments that are filled with the geopolymer absorbers; the suspension flow is indicated by arrows in the figure.
Method for measuring suspended-solid removal percentage
After washing the absorbers by applying flowing water for a period of 24 h to remove the impurities on/in them, the suspension fluid was poured into the upper right side of the inlet, as shown in Fig. 3; then, the filtered fluid was collected from the outlet, which is located at the bottom-left of the device (indicated by a circle in the figure). This was repeated three times; then, the SS removal percentages were obtained by weighing the residues after filtering and drying at 105~110 ℃ according to the ASTM standard for a test method and process for water quality estimation of polluted water [4]; the percentages were calculated by using eq. (1).
|
Fig. 1 Schematic diagram illustrating the procedure for making geopolymer absorber specimens. |
|
Fig. 2 Absorbers: (a) Geopolymer absorber made of IGCC slag; (b) Commercial clay base absorber for SS removal. |
|
Fig. 3 Small-scale laboratory-designed device for measuring the SS removal percentage; it has three compartments filled with geopolymer absorbers that are not shown in the figures. The flow direction of the suspension is indicated by arrows. The suspension outlet is indicated by a circle in the lower left corner of the figure. (a) A photograph of the device, and (b) a schematic diagram of the device. |

Comparison of SS removal percentages of geopolymer and commercial absorbers
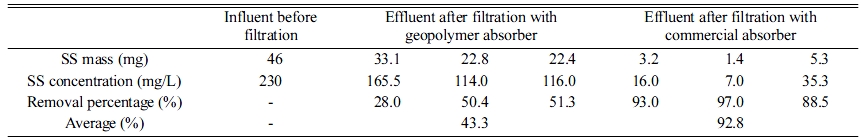
The SS removal percentages of the geopolymer and commercial absorbers were compared, as shown in Fig. 2; the results are listed in Table 2. The SS concentration of the influent water was 230 ppm; the average SS removal percentage was 43.3% after filtering with the geopolymer absorbers. The maximum average SS removal percentage was 92.8%, which is above the standard removal percentage (80%) of the commercial absorber.
Our next research objective was to increase the SS removal percentage of the geopolymer absorbers to a value that equals or is near that of the commercial counterpart. Firstly, the SS removal percentage was investigated as a function of the porosity of the absorbers. Secondly, the SS removal percentage was evaluated based on the size of the absorbers, i.e., the effects of the size of the absorbers were examined. Finally, the relationships between the SS removal percentage and density, pore size, and pore distribution were studied by making six different geopolymer absorbers with different densities and pore size distributions.
Suspended solid removal as a function of the porosity of the absorber
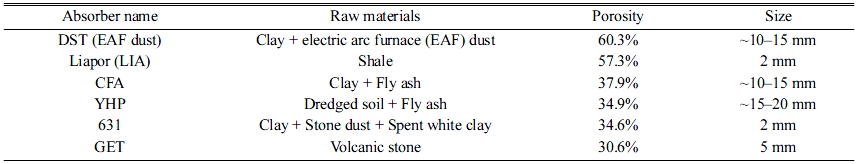
The effects of the porosity of the absorbers on the SS removal percentage were investigated in this experiment. The details of the absorbers used in this experiment are listed in Table 3, and the SS removal percentage results for each specimen are shown in Fig. 4.
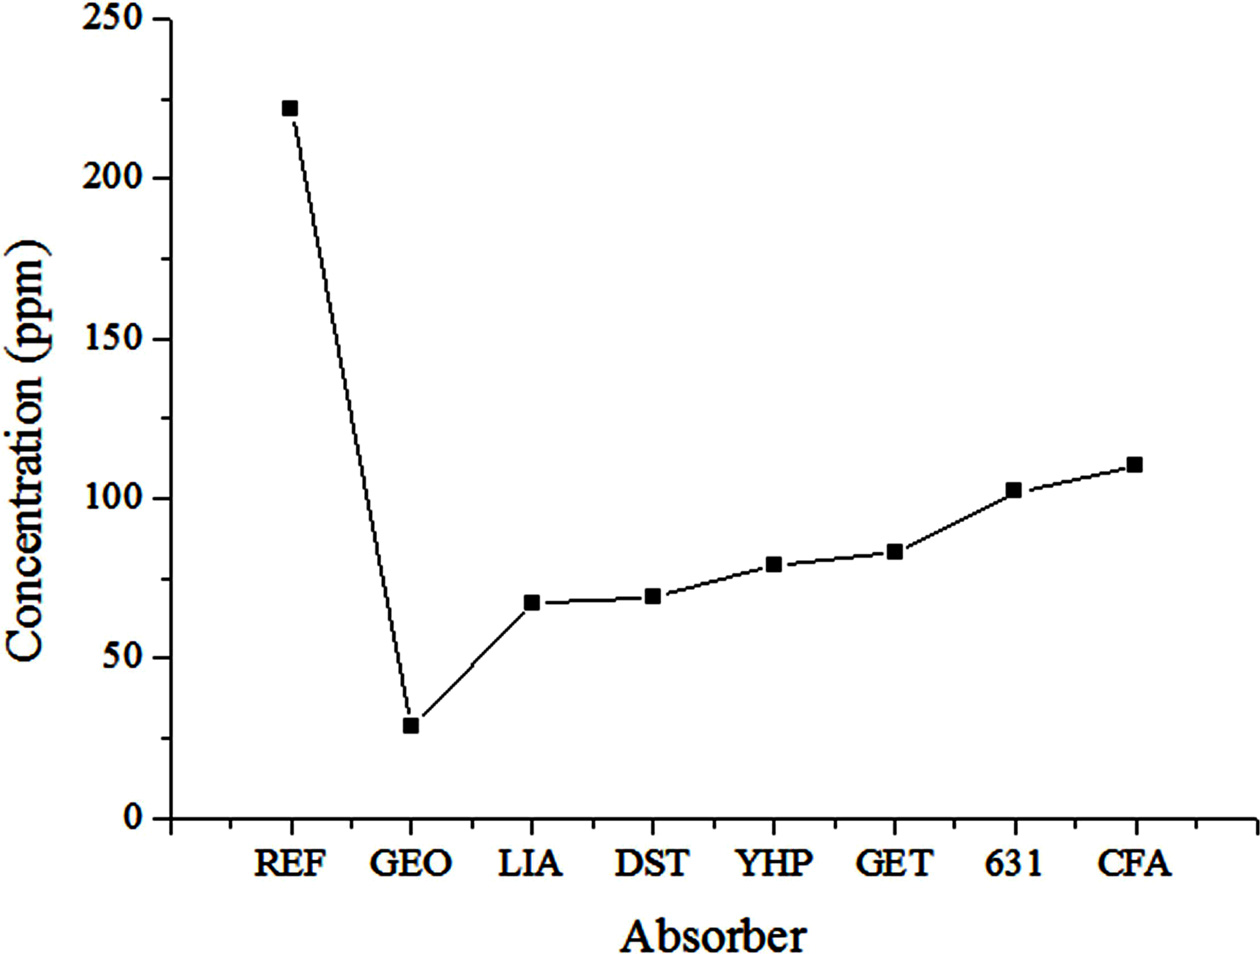
As shown in Fig. 4, the SS concentration of the influent water was 222 ppm. The SS removal percentages for LIA (57.3% porosity) and DST (60.3% porosity) absorbers, which had relatively high porosities, were 69.8% and 68.9%, respectively. These values were the highest among those of the six tested specimens; however, they did not meet the standard value recommended by the relevant Korean Standard (KS). Another point that must be considered is that the removal percentages for YHP (34.9% porosity) and GET (30.6% porosity) were 64.4% and 62.65%, respectively, which are still high SS removal percentages, even though they have a low porosity of 30%. This finding indicates that the SS removal percentage was not only dependent on the porosity of the absorber, but also on the pore size and distribution, specimen size, etc. Therefore, it was believed that systematic studies on these factors were necessary to investigate the mechanism and main factors affecting SS removal percentage; these studies are described in the following sections.
Suspended solid removal as a function of the size of the absorber
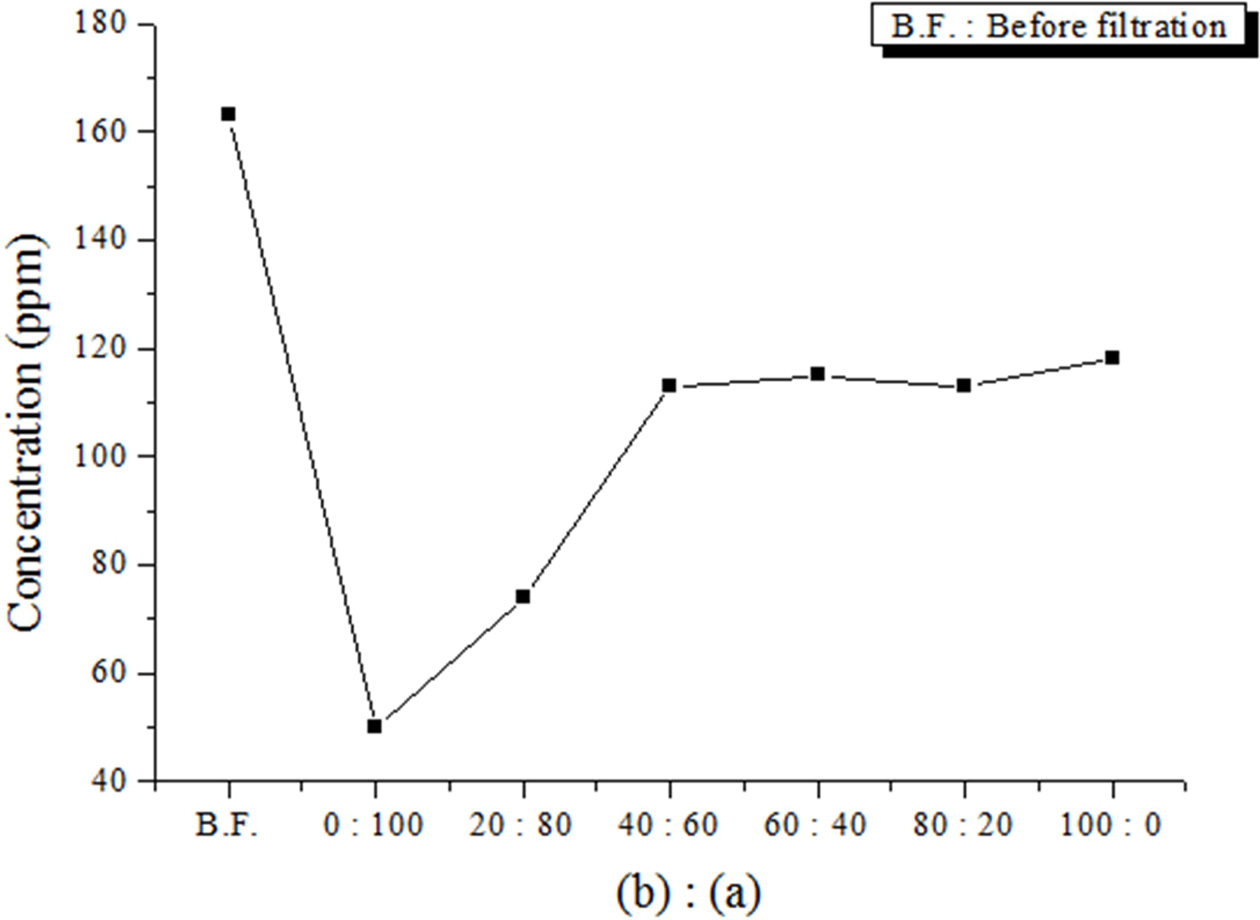
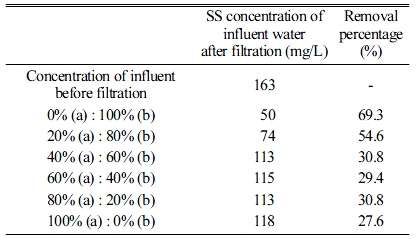
The effects of the size of the absorbers on the SS removal percentage were investigated by changing the mixing ratio for the 20 × 20 × 20 mm3 and 10 × 10 × 10 mm3 absorbers, which were similar to that shown in Fig. 2(a). As shown in Fig. 5 and Table 4, the SS removal percentage increased as the amount of smaller absorbers increased. When using only smaller absorbers, the maximum SS removal percentage was 69.3%. Therefore, based on the experimental results, the absorbers should have a high porosity, and their size must be sufficiently small to achieve the maximum SS removal percentage.
Because commercial absorbers are ~2–5 mm in diameter, and have many pores on their surfaces, as shown in Fig. 2(b), absorbers that are larger than commercial absorbers would yield a lower filling rate for the filtration space, and a smaller specific surface area; therefore, the SS removal percentage would be smaller. Moreover, the geopolymer absorbers do not have many pores on their surface, as shown in Fig. 2(a), because no bloating material was used to make pores. Therefore, it was expected that the SS removal percentage would exceed 69.3%, and would reach 80.0% if more pores were induced on the surface of the geopolymer absorbers by using a bloating material such as Si sludge, and if the absorbers were of a smaller size, i.e., similar to that of commercial absorbers.
Suspended solid removal as a function of the density of the geopolymer absorber
According to earlier research, a higher SS removal percentage can be achieved with a higher absorber porosity. It was speculated that the removal percentage would exceed 69.3% (i.e., that of the commercial absorber) if more pores were induced on the surface and within the specimens. Therefore, geopolymer specimens (absorbers) with six different densities and pore sizes were prepared to identify the relationship between the density of the absorber and the SS removal percentage [8, 9].
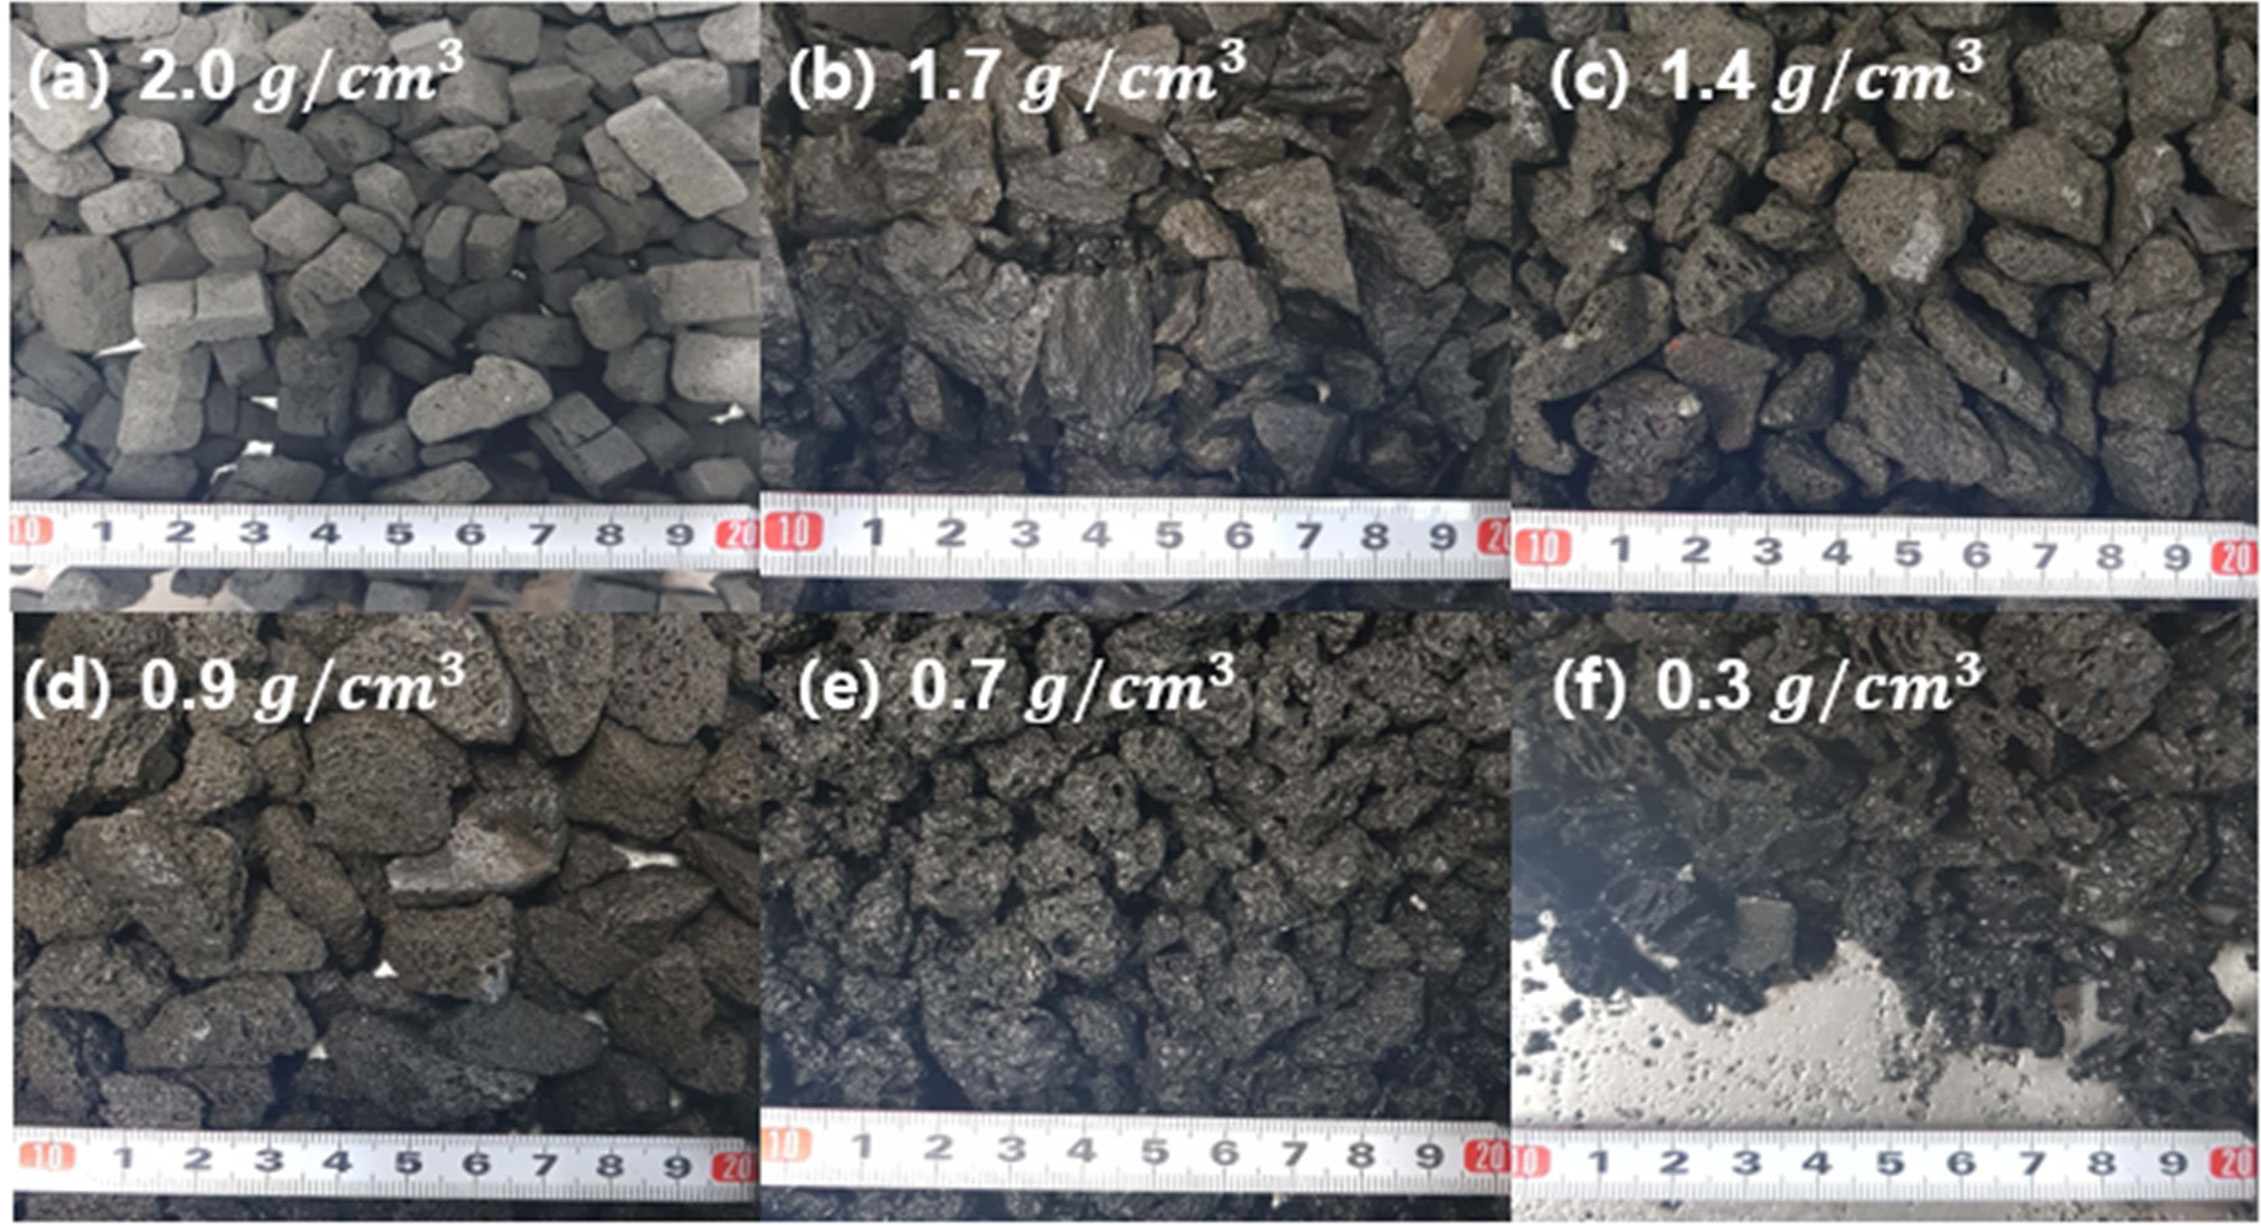
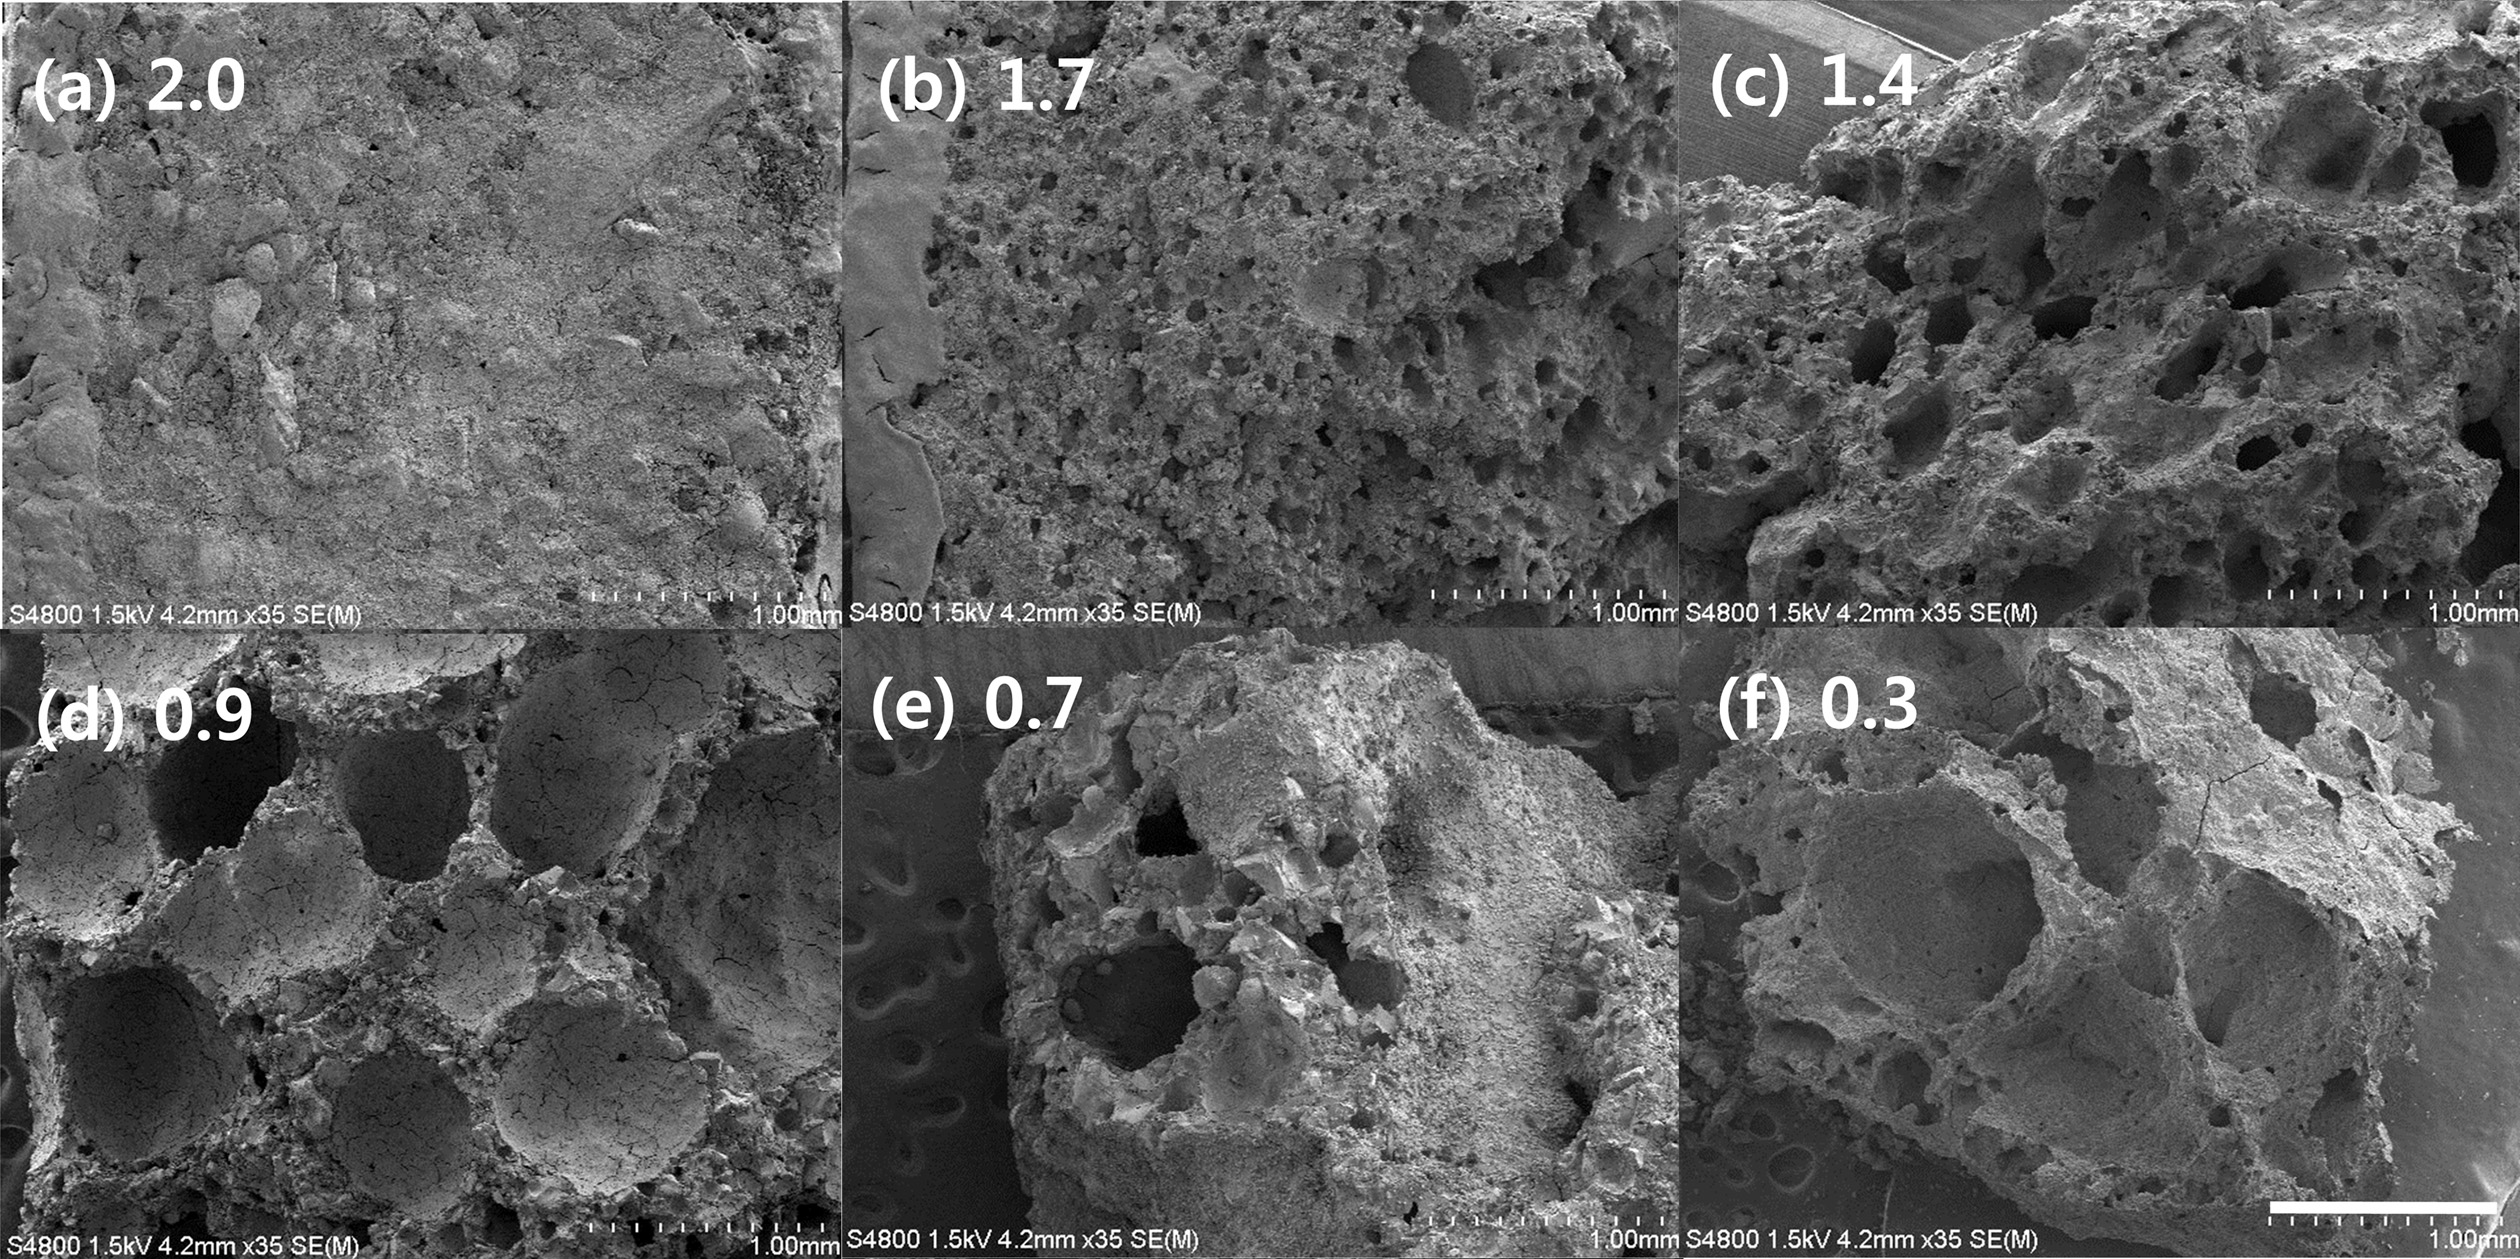
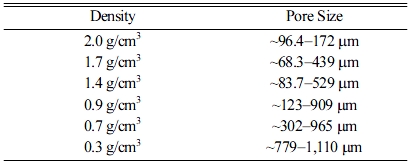
Geopolymer absorbers with densities of 2.0, 1.7, 1.4, 0.9, 0.7, and 0.3 g/cm3 were prepared by varying the Si content; Fig. 6 shows the SEM images of each specimen under two different magnifications. The average pore size of each specimen, as determined based on SEM observations, is listed in Table 5.
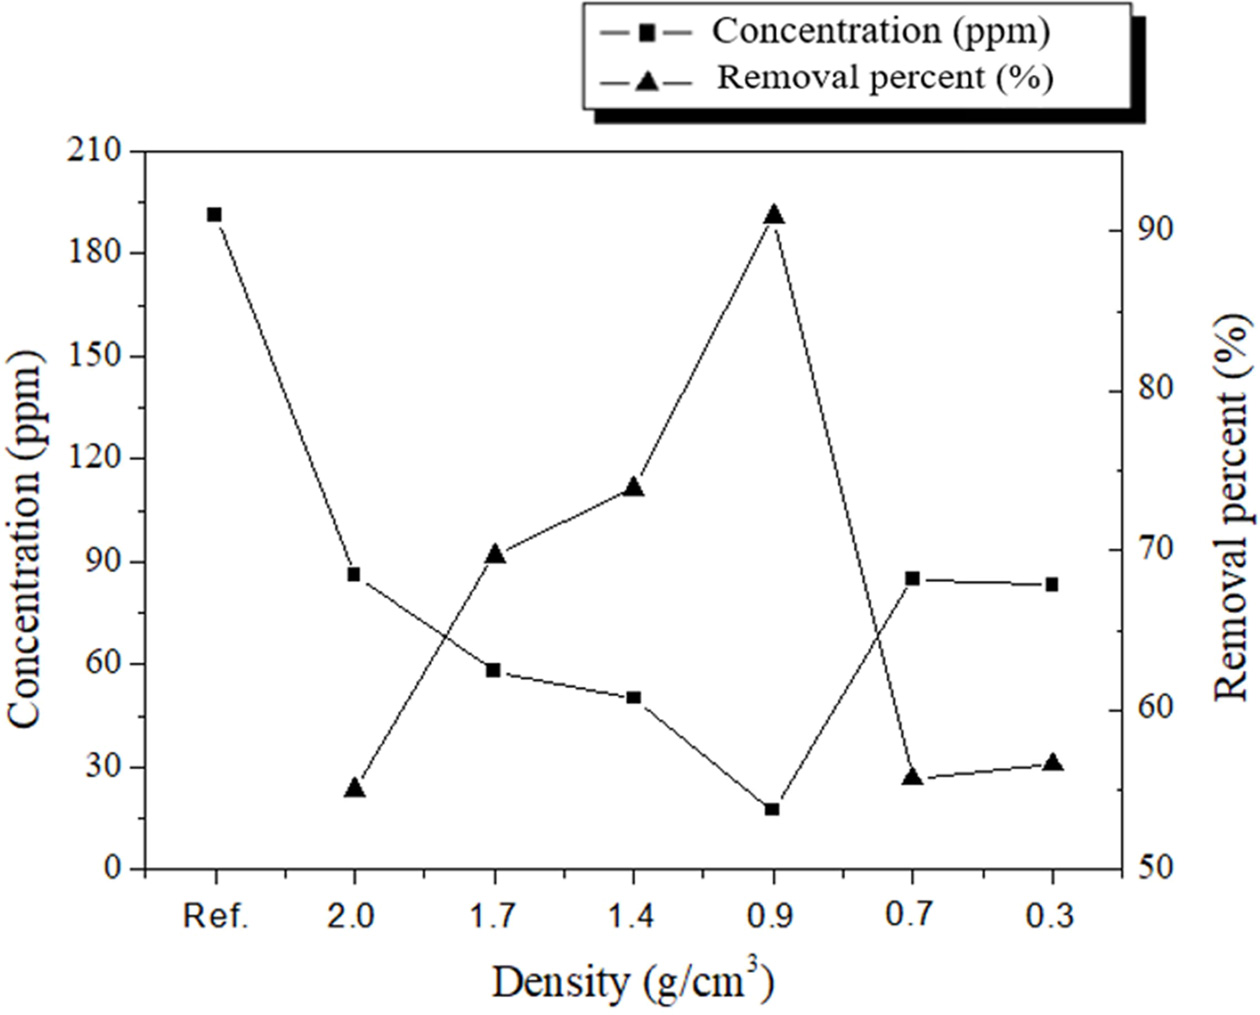
The lowest removal percentage was 55.0% (2.0-g/cm3 specimen), as shown in Fig. 7. However, the removal percentage tended to increase as the density increased to 0.9 g/cm3. The pore size distribution as a function of the density was determined by using the images shown in Fig. 8; the results are listed in Table 5. This table shows that the pore size increased as the density of the specimen decreased. However, the highest removal percentage was 91.0% (0.9-g/cm3 specimen); the removal percentages of the specimens with densities of 0.7 and 0.3 g/cm3 were 55.7% and 56.6%, respectively. The reason for this is closely related to the compressive strength of the specimens with densities lower than 0.7 g/cm3. Figs. 7 and 8 show debris that originated from the specimens as a result of collisions within the absorbers and/or collapses that were caused by additional bloating, which was a product of the reaction between unreacted Si sludge and water. The debris may have formed because of the low compressive strength of the low-density specimens, which were prepared by using a large amount of Si sludge. Therefore, it is speculated that this specimen debris increased the solid concentration in the suspension, although the density of the specimen was lower than 0.9 g/cm3.
|
Fig. 4 SS removal percentages of various absorber specimens. REF denotes the reference influent solution before filtering; GEO denotes the geopolymer absorber; the other aggregates are detailed in Table 3. |
|
Fig. 5 SS removal as a function of the mixture ratio of (a) and (b) absorbers, where (a) and (b) denote 20 × 20 × 20 mm3 and 10 × 10 × 10 mm3 geopolymer absorber specimens, respectively. |
|
Fig. 6 Low-magnification SEM macro-images of geopolymer absorbers with various densities. The scale bar and density of the specimen are displayed in each photo. |
|
Fig. 7 SS removal percentages of geopolymer absorbers with various densities. The left axis shows the concentration in the suspension, and the right axis shows the SS removal percentage after the suspension passed through the filtering device. Ref. denotes the concentration of SS before filtration. |
|
Fig. 8 SEM observations of the microstructure of geopolymer absorbers with various densities; the magnification is higher than that shown in Fig. 7. |
|
Table 2 Mass, concentrations, and removal percentages for influent after filtration with geopolymer and commercial absorbers. |
|
Table 3 Raw materials, porosities, and specimen sizes of various absorbers used in this study. |
|
Table 4 SS removal percentages according to the mixing ratios of the (a) 20 × 20 × 20 mm3 and (b) 10 × 10 × 10 mm3 geopolymer absorber specimens. |
|
Table 5 Pore size distribution according to the density of the geopolymer absorber. |
This study was performed to obtain basic data to evaluate the applicability of geopolymers as absorbers for the removal of pollutants (SS) that have infiltrated rainwater. In the early stage of the study, the removal percentage of the geopolymer absorbers was 42.3%, which is considerably lower than that (92.8%) of commercial absorbers. Therefore, the effects of porosity, specimen size, pore size and distribution, etc. on the removal percentage were investigated to enhance the SS removal percentage of the geopolymer absorbers.
Many factors influenced the SS removal percentage; however, the optimum density of the geopolymer absorbers was 0.9 g/cm3, and the optimum pore size range was ~123–909 μm. The SS removal percentage under the optimized conditions was 91.0%, which is equivalent to that of commercial absorbers, and above the recommended standard value. The next step for this research is to confirm the SS removal percentage of the geopolymer absorbers by using a normal-scale test machine, and to develop a novel reverse cleaning process for long-term absorber use.
This work was supported by a 2018 Kyonggi University research grant.
- 1. H.K. Choi, J.Y. Park and S.J. Park, J. Ind. Technol. 26[A] (2006) 119-127.
- 2. W.M. Heo, S.Y. Kwon, Y.G. Kim, W.H. Yih, and B.C. Kim, Korean J. Limnol. 38[3] (2005) 322-333.
- 3. S.Y. Hwang and G.S. Lee, J. Korean Soc. Environ. Adm. 17[1] (2011) 67-73.
- 4. ASTM Standards, No. D 3977-97 (2013).
- 5. J.Y. Park and W. Jung, Membr. J. 19[4] (2009) 268-276.
- 6. Y.M. Koo, J.Y. Kim, B.R. Kim, and D.G. Seo, J. Korean Soc. Environ. Eng. 37[3] (2015) 165-174.
-

- 7. Y.J. Kim, D.G. Kim, H.H. Lee, and T.S. Chang, J. Korean Soc. Environ. Eng. 30[7] (2008) 683-687.
- 8. J.H. Huh, Y.H. Choi, S.H. Lee, S.H. Cheong, and J.W. Ahn, J. Korean Ceram. Soc. 54[2] (2017) 108-113.
-
- 9. Z. Wu, L. Sun, and J. Wang, J. Korean Ceram. Soc. 55[6] (2018) 527-555.
-
 This Article
-
2019; 20(5): 570-576
Published on Oct 31, 2019
- 10.36410/jcpr.2019.20.5.570
- Received on Apr 17, 2019
- Revised on Aug 6, 2019
- Accepted on Aug 14, 2019
Services
- Abstract
introduction
experimental methods
results and discussion
conclusions
- Acknowledgements
- References
- Full Text PDF
Shared
Correspondence to
- Yootaek Kim
-
Department of Materials Engineering, Kyonggi University, Suwon 16227, Korea
Tel : +82-70-4024-9765
Fax: +82-31-249-9774 - E-mail: ytkim@kgu.ac.kr
Clean-Energy Research Institute(CRI), Hanyang University, 222, Wangsimni-ro, Seongdong-gu, Seoul, 04763, Korea
E-mail: jcpr@hanyang.ac.kr