


- Synthesis and analysis of the influence of Eu3+ on the structural, ferromagnetic, dielectric and conductive characteristics of Ni0.4Zn0.45Cu0.15Fe(2-x)EuxO4 composites using conventional double sintering ceramic method
I.N. Eshaa, Md. Al-Aminb, F.T.Z. Tomac, Enayet Hossaina, M.N.I. Khand and Kazi Hanium Mariaa,*
aDepartment of physics, University of Dhaka, Dhaka-1000, Bangladesh
bNuclear Power Plant Company Bangladesh Limited, Ramna, Dhaka-1217, Bangladesh
cExperimental Physics Division, Atomic Energy Centre, Dhaka-1000, Bangladesh
dMaterials Science Division, Atomic Energy Centre, Dhaka-1000, Bangladesh
Conventional double sintering ceramic method has been followed to prepare a series of Eu substituted Ni0.4Zn0.45Cu0.15Fe(2-x) EuxO4 (NZCFEO) ferrites with x = 0.00, 0.02, 0.04, 0.07, 0.10, 0.12, 0.15. X-ray diffraction peaks confirm the single phase cubic spinel structures of all the samples. The lattice parameter is found to be distorted with the addition of Eu into the samples. X-ray density and bulk density increase with the increase of Eu content. Better crystallization has been obtained with the decreasing porosity as a result of increasing Eu3+ concentration. The dielectric constant of the samples shows a decreasing trend while both AC and DC resistivities are observed to increase with the increase of Eu3+ concentration. The high resistivity offers greater value of the activation energy. Permeability is found to decrease with increasing Eu content. Saturation magnetization changed significantly with Eu3+ concentration. Noteworthy decrease of the Curie temperature is observed with the addition of Eu substituent.
Keywords: Dielectric, AC resistivity, Permeability, Curie temperature, M-H Curve
Ni-Zn-Cu ferrites are one of the well-known spinel ferrites to be used in various electromagnetic devices due to their high resistivity, high permeability and comparatively low magnetic losses [1-5]. It has attracted attention for the application in producing multilayer-type chip inductors because of its better properties at high frequencies. The structure of spinel ferrites consists of a cubic close packed array of anions with one eight of the tetrahedral (A) and one half of the octahedral (B) interstitial sites occupied by cations. In general, a binary oxide spinel can be described by A1-xBx[AxB 2-x]O4, here x is called degree of inversion which takes value 0 and 1 for the normal and inverse spinel respectively. Elements such as Ni, Zn, and Cu can be substituted at the tetrahedral site and octahedral site in the Fe2O4 ferrite [6]. And the magnetic properties of the spinel ferrite could be changed by substituted elements [6]. The other factors are crystal size and uniformity of spinel ferrite. Zn and Cu are mainly substituted at the A-site in the tetrahedral, and Ni is mainly substituted at the B-site in the octahedral. The substituted Ni, Zn, and Cu change the saturation magnetization value of ferrite. It is because that Ni2+, Zn2+, and Cu2+ ions has the different net moments from Fe2+ ion.
Rare earth (RE) elements have multiple applications that connect many aspects of modern life and culture as they have unusual physical and chemical properties. They are used as important additives to other elements, and are seldom used entirely by themselves. REs are used individually or in combination to make phosphors, many types of ray tubes, flat panel displays, in screens that range in size from smart phone displays to stadium scoreboards, in many light bulbs, panels, and televisions. The effect of Fe replacement by rare earth (RE) ions such as Yb, Er, Sm, TB, Gd, Dy and Ce on the properties of Ni0.7Zn0.3Fe2O4 ferrite have already been studied [6]. Small replacement of Fe ions by rare earths may influence the electrical and magnetic properties of ferrite. The rare earth ions can be classified into two categories, one with the radius that is close to Fe ions while the other with that larger than Fe ions [7]. The addition of rare earth ions with large ionic radii creates local distortion and disorder. The rare earth (RE) ions contain unpaired 4f electrons and can produce more efficient spin-orbit coupling of angular momentum [8]. Moreover, 5S25P6 shield the 4f shell of rare earth ions and almost unaffected by the potential field of surrounding ions. The addition of rare earth ions into spinel ferrite leads to turn up 4f-3d couplings which may have effect on structural, magnetic, electrical properties of ferrite [7, 9-11].
Recently, among the various rare earths, the influence of Eu3+ ions on structural, electrical, and magnetic properties of ferrites have been investigated by many researchers [12-14] due to its reactive nature. Therefore, replacement of Fe with Eu is expected to have influential role on the conduction process. Furthermore, Eu has enchanted the researchers for its fascinating magnetic behavior as Eu appears magnetic at very low temperature but reveals its nonmagnetic properties at room temperature [15]. The added Eu3+ ions generate remarkable congestion magnetization which can acclimatize the ferrite properties. Besides, Eu3+ acts as anisotropic or isotropic as it is accompanying with the unpaired f-shell electron. The acquaintance of trivalent rare earth Eu3+ ions with the spinel ferrite will produce the Fe3+-Eu3+ interaction. This interaction has developed the magnetic properties [16].
All these properties of Eu have intensified our interest to research on Eu though many researchers have studied Eu substituted ferrite. Sun et al. substituted a little amount of Eu ions in place of Fe3+ and found that the electrical resistivity and relative loss factor increased while the Curie temperature was observed to decrease [11]. Jacobo et al investigated on
Zn0.5Ni0.5R 0.02Fe1.98O4 with R=Gd, Eu and Y and noticed that the coercive field increased with the substitution of Eu [17]. After that Iqbal et al. found a small increase in the hyperfine field parameters and a strong decrease of the total resonant area in Zn0.5Ni0.5Fe1.98Eu0.02O4 ferrites compared to the pure Ni-Zn ferrite [12]. To the best of our knowledge, no research work has been shown on the effect of Eu substitution in Ni0.4Zn0.45Cu0.15Fe2O4 ferrites. Ni-Zn-Cu ferrite is preferred as parent material as high coupling co-efficient was reported for Jahn-Teller ions such as, Zn2+, Cu2+etc [18, 19]. Hence, the present research work reports the role of Eu in the structural, electrical and magnetic properties of Ni-Zn-Cu ferrites with various concentrations.
In order to obtain optimized properties the choice of suitable fabrication process is very essential. The large number of sample preparation methods is basically grouped into two different parts, such as, conventional ceramic method and non-conventional ceramic method. The other name of conventional ceramic method is double sintering ceramic technique. In this method the compounds are gone under heat treatment for twice. The first one is called pre-sintering and the other one is sintering. Two step sintering is a promising approach to obtain fully dense nanograin ceramics because it suppresses grain growth in the final stage of sintering. In successful two-step sintering, grain size should remain constant while density continues to increase, unlike in normal sintering in which final stage densification is always accompanied by rapid grain growth. Now days, most of the ceramic materials are made through the sintering technique because of being the most vital fabrication process of ceramic materials [20]. As sintering is a process through which powdered particles are coalesced together by solid-state diffusion at high temperatures but below the melting point of the compounds which are being sintered together via solid-state diffusion, the characteristics of ceramic materials can extensively be customized through this. While pre-sintering is important for phase formation, the grain growth and densification of the samples occurs at the sintering stage. Consequently, porosity, a dominant factor to affect the performance of ceramics, largely depend on sintering temperature and holding time. Double sintered samples are less porous, more densified with greater flexural strength and hardness compared to compounds prepared by non-conventional techniques [21]. Moreover, this process is cost effective. Bearing all these in minds, ferrites with chemical formula Ni0.4Zn0.45Cu0.15Fe(2-x)EuxO4 where x = 0.00 to 0.15 were synthesized by conventional double sintering ceramic technique using raw powders of Fe2O3, NiO, ZnO, CuO and Eu2O3 (≥99.5%). After weighing according to stoichiometric proportions, the reagent powders were mixed thoroughly using mortar and pestle by hand milling for 6 hours. These powders were dried and pressed into disc shapes to calcine at 800 oC for 4 hours for the formation of ferrite by chemical reaction. Then pre-sintered samples were crushed again for 2 hours and polyvinyl alcohol was added as a binder with the powders. The obtained powders were finally pressed into pellets and toroids and sintered at 1200 oC for 3 hours. The surfaces of the samples were polished carefully to remove the roughness and any layer of oxide produced during sintering process. Phase identification and crystal structure were obtained from X-ray diffractions using Phillips (PW3040) X’Pert Pro X-ray diffractometer. By using Scanning Electron Microscope, the microstructure and surface morphology were obtained. After coating the two surfaces of the pellets with silver paste as contact material, frequency dependent dielectric constant and resistivity have been obtained with the help of Wayne Kerr Impedance Analyzer (6500B) by two probe method. The Wayne Kerr Impedance Analyzer (6500B) was used to measure the frequency dependent permeability by winding the toroids with wire of 5 turns. DC resistivity was perceived by the help of Keithley (6514) System Electrometer. The Vibrating Sample Magnetometer (VSM) was used to survey the magnetic hysteresis loops of the samples.
Structural characterization
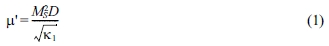
The XRD patterns for NZCFEO are shown in Fig. 1 and the miller indices are calculated from this figure. The miller indices of the peaks are (111), (220), (222), (311), (400), (422), (511), (440) and (533) indicating cubic spinel ferrite. No diffraction peaks other than EuFeO3 are observed which confirms the single phase inverse spinel structure of all the samples. The peak of EuFeO3 also indicates that there may have some chemical reaction during the sintering process. The samples with lower Eu concentration show better crystallization with the enhanced intensity of the highest peak. The highest intensity peak, (311), is observed to shift slightly toward smaller angle from x = 0.02 to x = 0.15. The highest intensity peak may correlated with the lower inter-planar distance and the tensile stress. The variation of stress might be due to the different valances and ionic radii of substituted Eu [22]. Nearly matchable trend in results were obtained by various researchers while doping RE elements such as Pr, Sm, Gd, Dy, Eu, Y etc. with various ferrites prepared by different methods [17, 23-26].
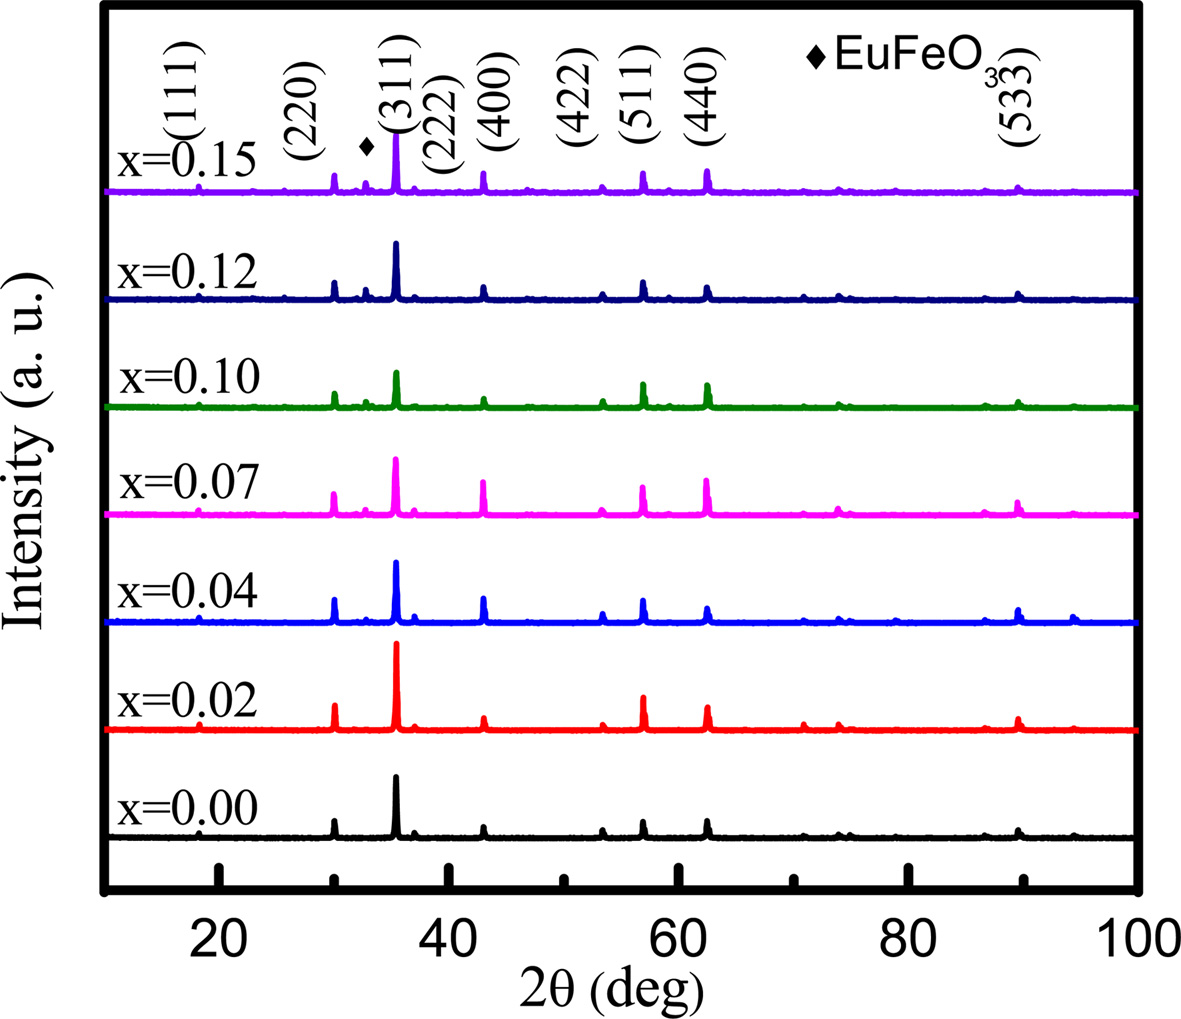
The lattice parameter has been calculated by using Nelson-Riley function, F (θ) [27]. The variation of lattice parameter with increasing Eu content is shown in Fig. 2. It is observed that lattice parameter increases with the Eu content obeying Vegard’s law [28].
This variation can be explained on the basis of an ionic size difference of the component ions. The ionic radius of Eu is larger than that of Fe. As a consequence, lattice spacing increases for replacing Fe3+ (0.67 Å) [7] by Eu3+ (1.07 Å) [16]. A small amount of europium occupies the octahedral B-sites. Hence the increase in lattice parameter is attributed to the replacement of smaller Fe3+ ions from B-sites to A-sites by larger Eu3+. The Eu3+ ions successfully replace the Fe3+ ions in B-sites. The unit cell expands to accumulate the larger ions. Thus the addition of Eu3+ ion is expected to increase the lattice parameter. A. Zubair et al. also found quiet similar results of increased lattice parameter while working on Eu doped CoFe2O4[16].
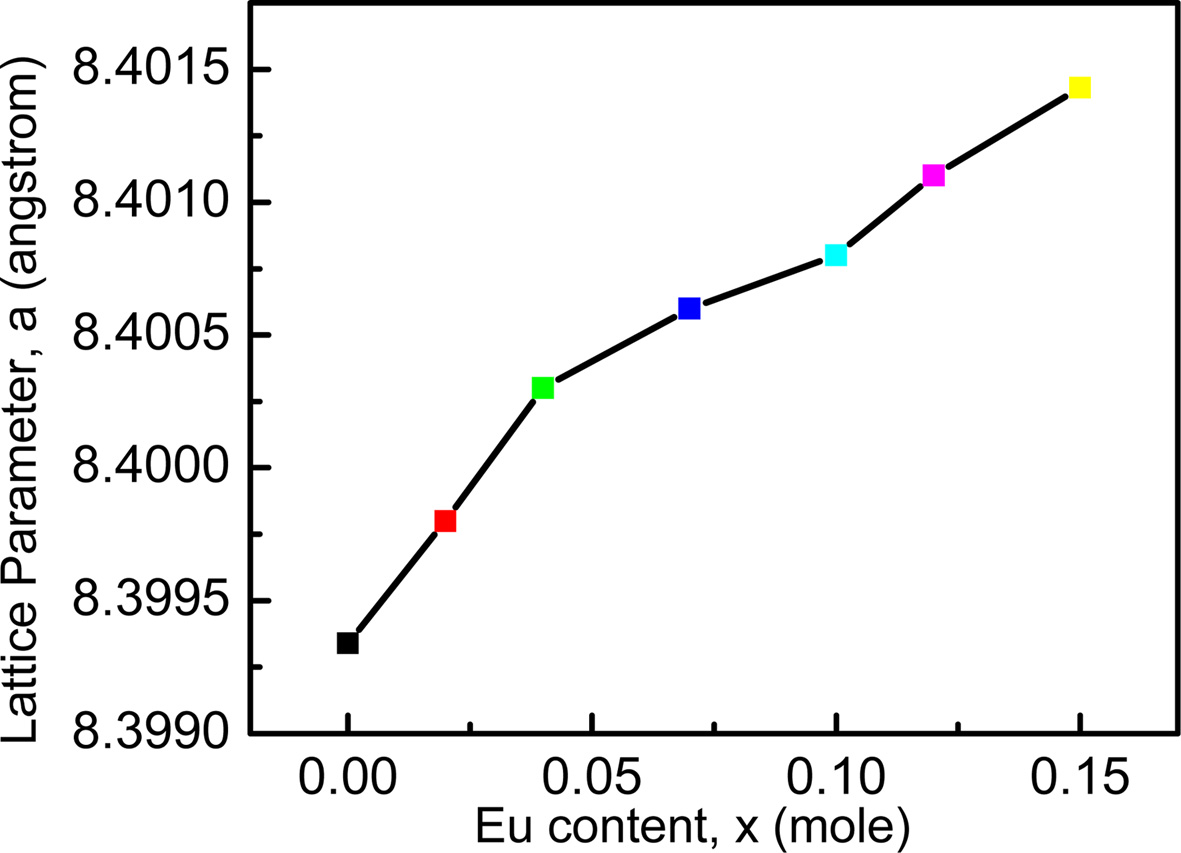
Fig. 3 reveals the variation of bulk density, X-ray density and porosity of NZCFEO with Eu content. As the atomic mass of Eu (151.96 u) is greater than that of Fe (55.85 u) [29, 30], the X-ray density may have increased with the increase of Eu content. The bulk density ρB also shows the increasing trend just like as X-ray density with the increase in Eu contents. The X-ray density is found to have higher value than bulk density which occurs as a result of porosity built during sintering process [31]. The bulk density variation with the Eu concentration probably arises for the presence of cracks, pores or vacancies in the lattice. The variation of porosity with Eu content behaves exactly opposite to the bulk density. In the present series, both the molecular weight of the NZCFEO spinel ferrite and the volume of the unit cell increase with increasing Eu substitution. Therefore, the bulk density increases with Eu substitution, which leads to a decrease in porosity (P). The decrease in porosity may be due to the increase in crystallite size, which decreases the grain boundaries of the crystallite and accordingly the porosity [32, 33]. Usually, discontinuous grain growth may produce intra-granular porosities and these pores are left behind by the rapidly moving grain boundaries. High sintering temperature or prolonged sintering time enhances the gain growth rate which in turn trapped the pores within the grains [33]. This intra-granular porosity is quite impossible to eliminate, as a result leading to poor magnetic and mechanical properties [34].
Microstructural study
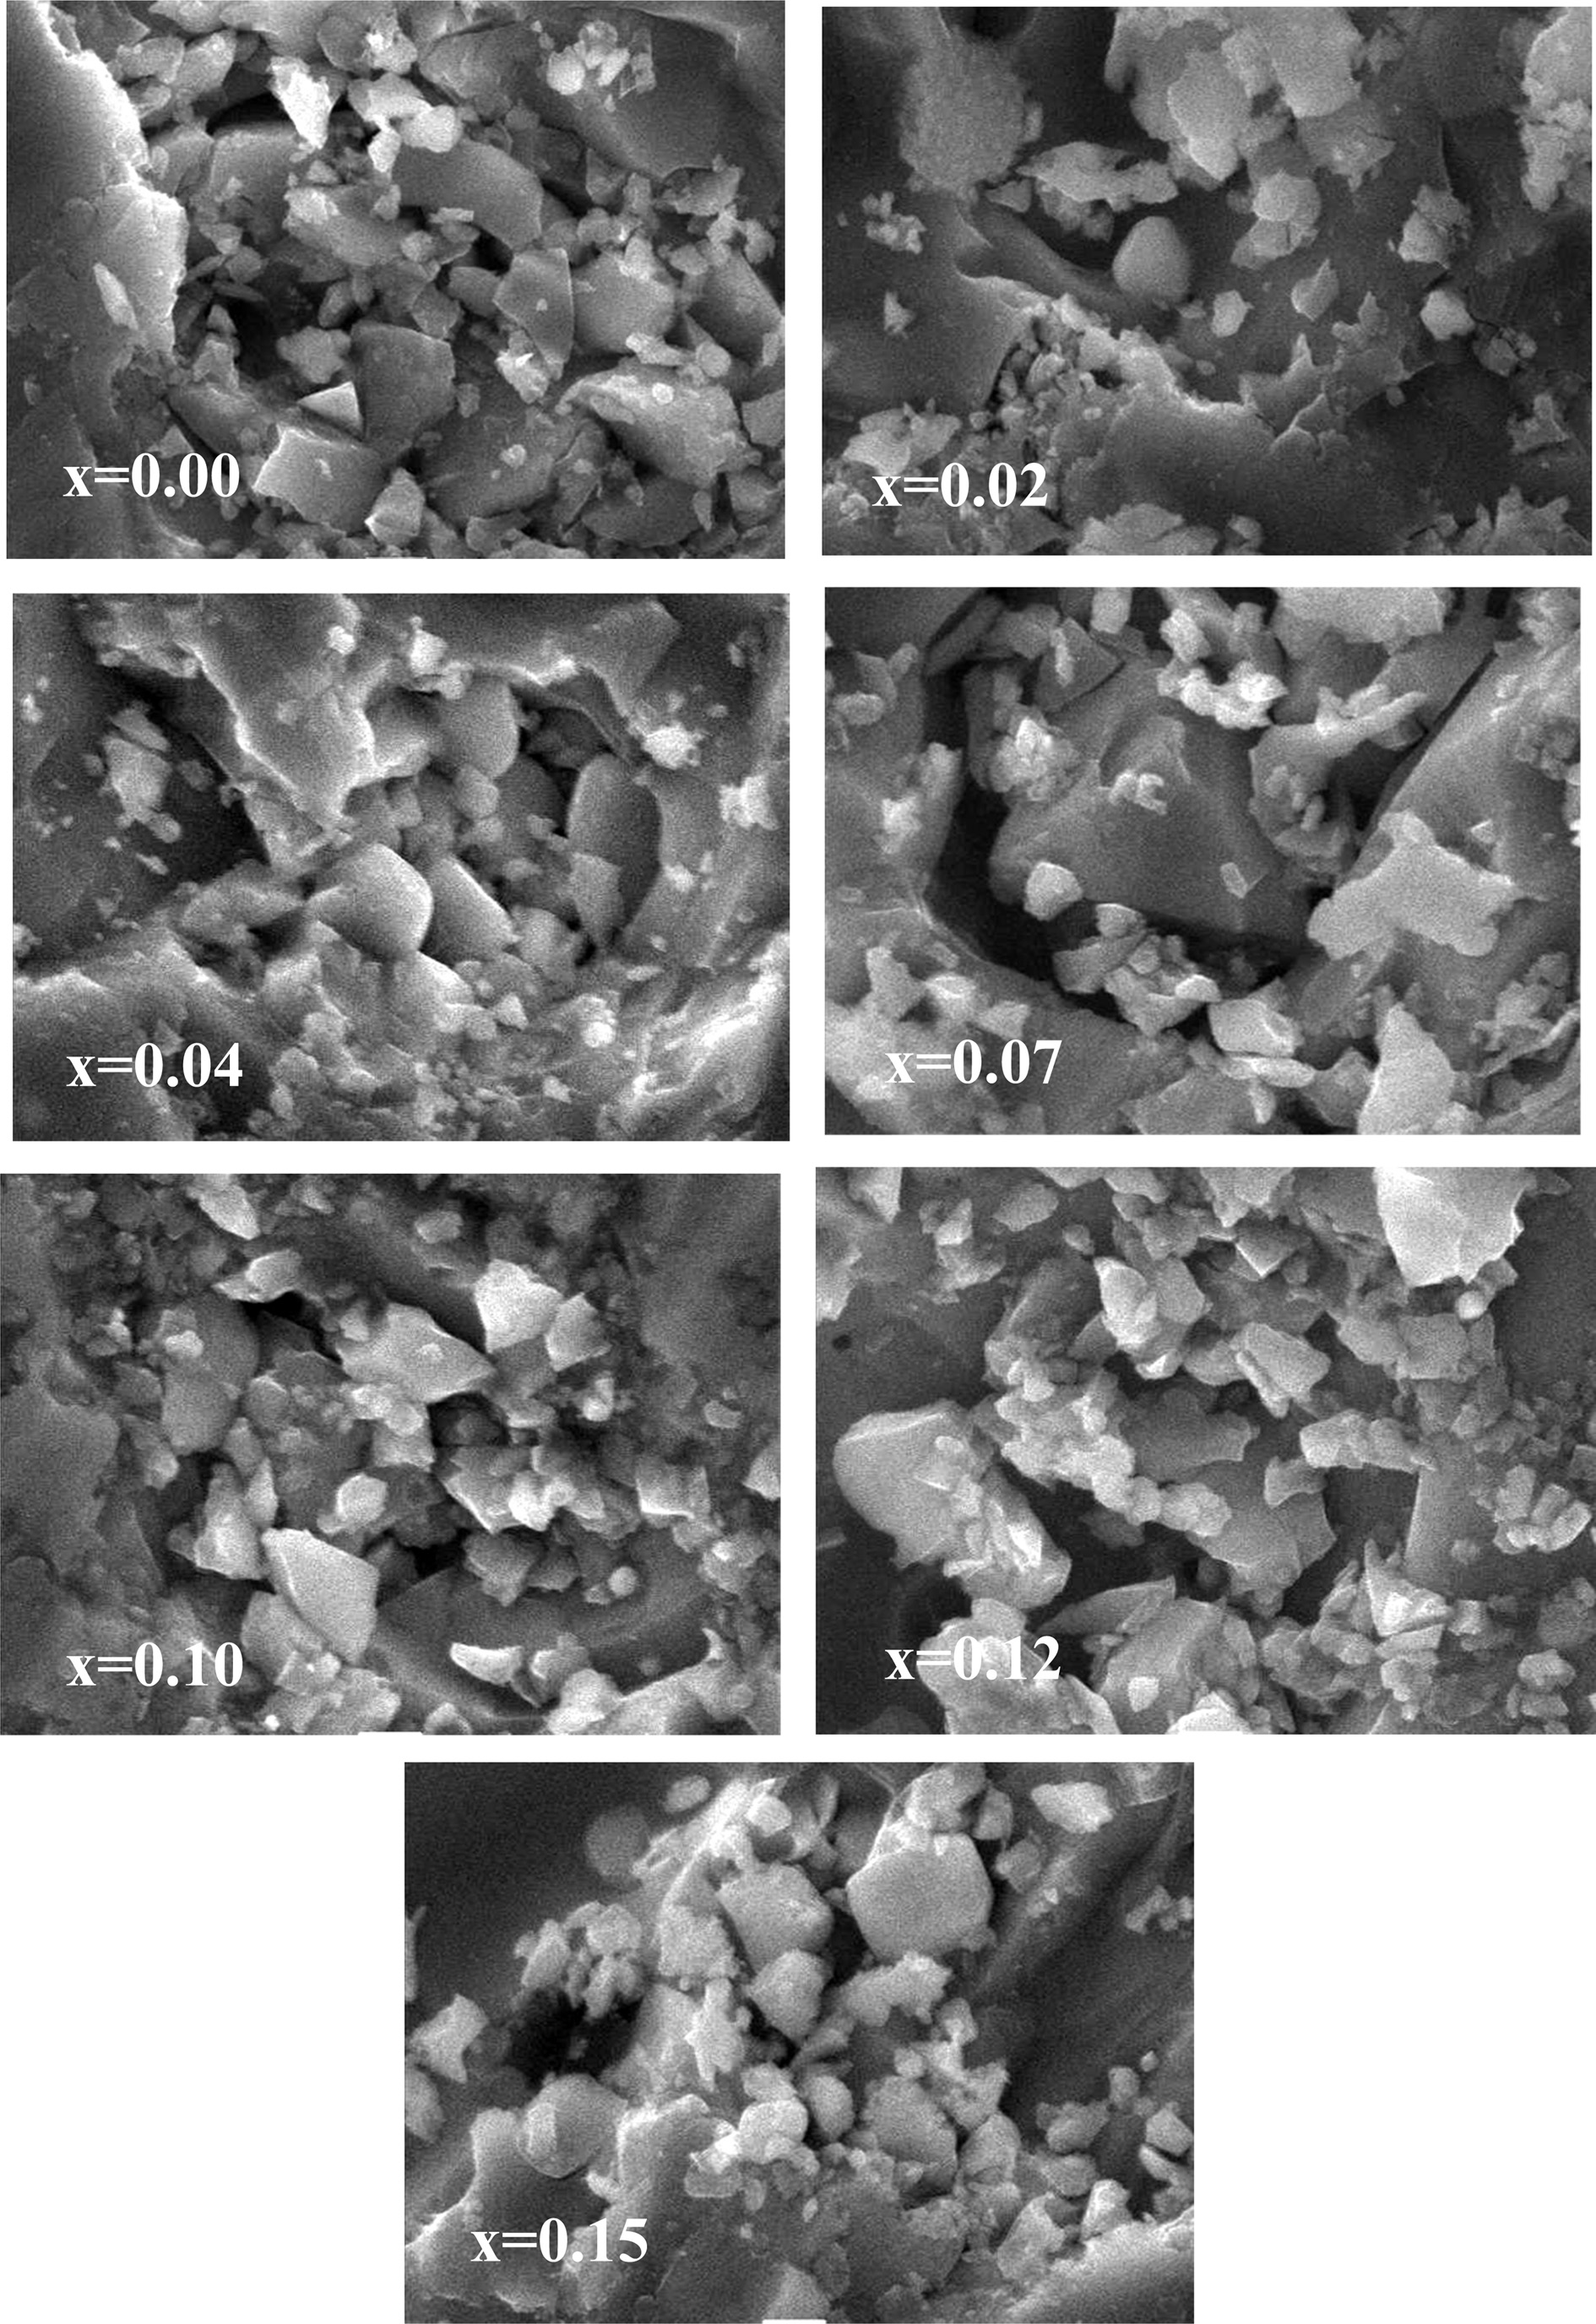
Admirable crystalline structure can be observed from the micrographs of Fig. 4 for the Ni0.4Zn0.45Cu0.15Fe (2-x)EuxO4 samples. The grain size decreases gradually with the increasing concentration of Eu which supports the decrease of permeability shown in Fig. 8(a). Moreover with the decreasing grain size the pores shift towards the grain boundary [35]. Consequently, the inter-granular porosity reduces and density increases which can be observed from Fig. 3 obtained from XRD.
Dielectric measurement:
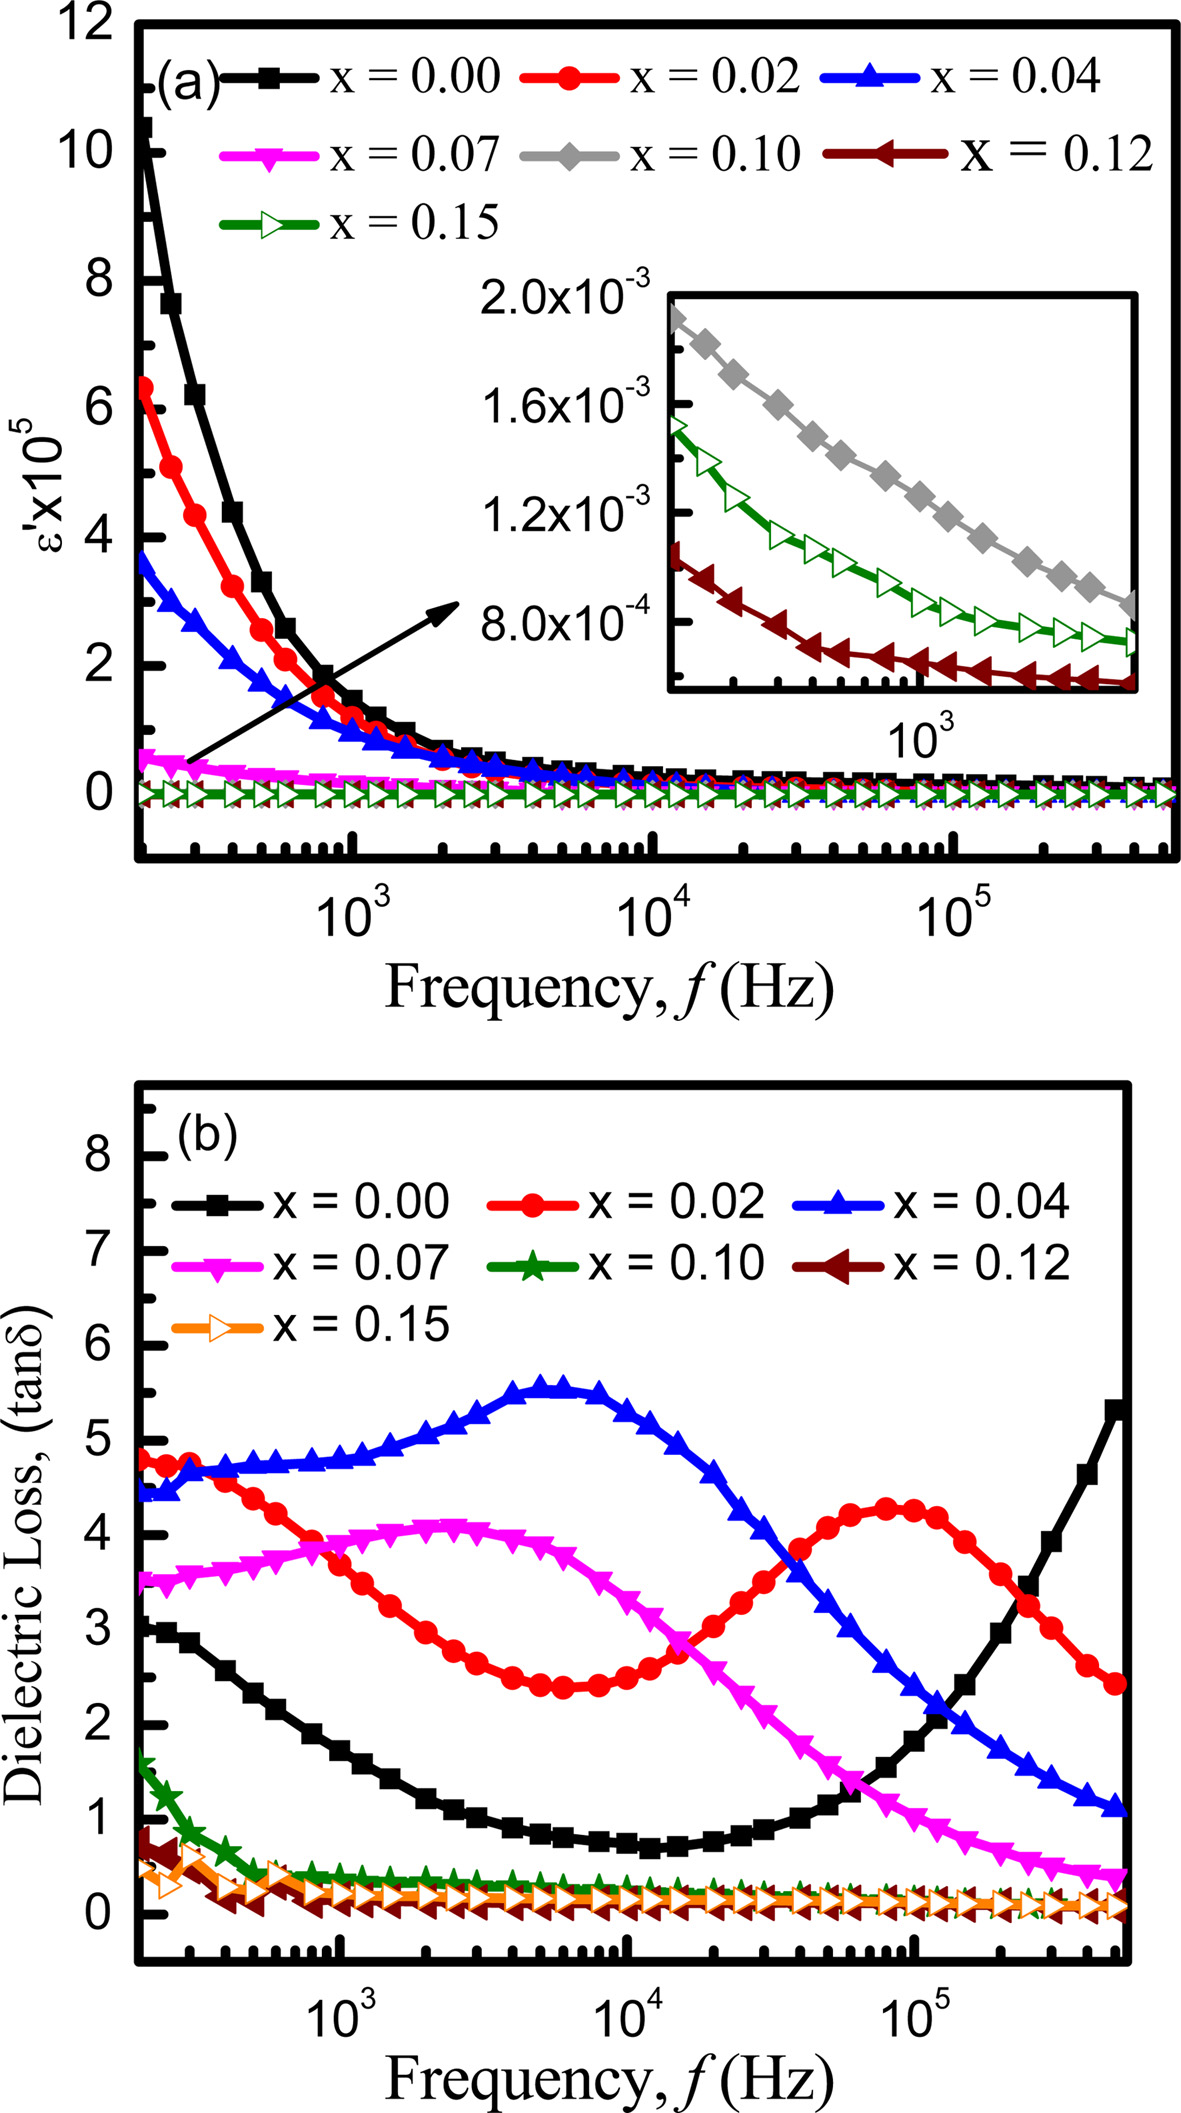
The variation of dielectric constant (ε') with the frequency ranging from 200 Hz to 0.5 MHz at room temperature is shown in Fig. 5(a). It is clearly seen that the dielectric constant (ε') decreases with increasing frequencies rapidly at lower frequency but slowly at higher frequencies. After that it shows a stable nature. Generally this is the normal dielectric behavior of spinel ferrite [36] which can be explained by dielectric polarization mechanism [37]. The dielectric polarization mechanism is analogous to that of the conduction mechanism. Dielectric dispersion at lower frequency region can be explained by the Maxwell-Wegner [36] interfacial type of polarization, which is in agreement with Koop’s phenomenological theory [38]. According to K.H. Maria et al. electron hopping between ions occurs in divalent ferrite and these electrons are randomly distributed at crystallographic lattice sites. This hopping of electron leads the electronic conduction of ferrites. A large number of Fe2+generates at the time of sintering which accelerates the electron hopping between +2 and +3 valance states. Generation of Fe2+ depends on sintering time and grain structure, and ferrite material property are related with the concentration of Fe2+ ions present in the metal [39]. The hopping between Fe2+ and Fe3+ outcomes with the local displacement of charge carriers in the same direction of the applied electric field, which is the reason behind the polarization in ferrites. The exchange magnitude relies on the Fe2+/Fe3+ ion pair’s concentration available at B-site [39]. With the increasing frequency, the ability of the exchange of electrons to follow the applied field decreases [40]. Hence, dielectric constant also decreases. At very high frequencies, the field reverses before the movement of space charge carriers and as a result, it does not contribute to polarization. Consequently, dielectric constant is almost constant at higher frequencies.
Fig. 5(a) shows that dielectric dispersion decreases with increasing europium content. As Eu3+ ions have larger ionic radii, it occupies octahedral B-sites [13]. On the contrary, Fe3+ concentration gradually decreases with increasing Eu content. Since, Fe ions play a dominant role in dielectric polarization, their deficiency in B-site end, with the decrease of polarization [41]. As a result, dielectric constant decreases with increasing Eu contents except at x = 0.15. The decrease in dielectric constant may also occur due to the decrease of grain size [42]. It is also evident from Fig. 1 that the intensity peak of EuFeO3 is maximum for x = 0.15, which may have contributed to increase the interfacial polarization resulting in the decrease of dielectric constant. Fig. 5(b) shows the loss factor variation with frequency. The relaxation peaks can be easily noticed at different frequencies for different concentrations of Eu from the Fig. 5(b). When the applied field frequency is nearly the same as the charge carriers’ hopping frequency, resonance occurs. Although the rare earth substitutions were reported to improve the dielectric properties [43], in our case, the Eu substituted samples have smaller relaxation frequency than the parent material. The variations of structural parameters may have influenced the relaxation frequency. It is also observed that loss factor decreased with increasing frequency for x = 0.10, 0.12, 0.15. At low frequencies, the grain boundaries are strong whereas well conducting grains are more operative at high frequencies. Therefore, dielectric loss decreases with increasing frequency [44]. A few researchers showed almost the same trend of variation in dielectric constant and loss factor [24, 45-46]. Among them according to P. C. Sati et al. although the dielectric constants become lower with the substitution of Eu, the dielectric losses vary anomalously with the increased Eu. Relaxation peaks are also observed at low and high frequencies which supports the obtained Fig. 5(b) [24].
Resistivity measurement
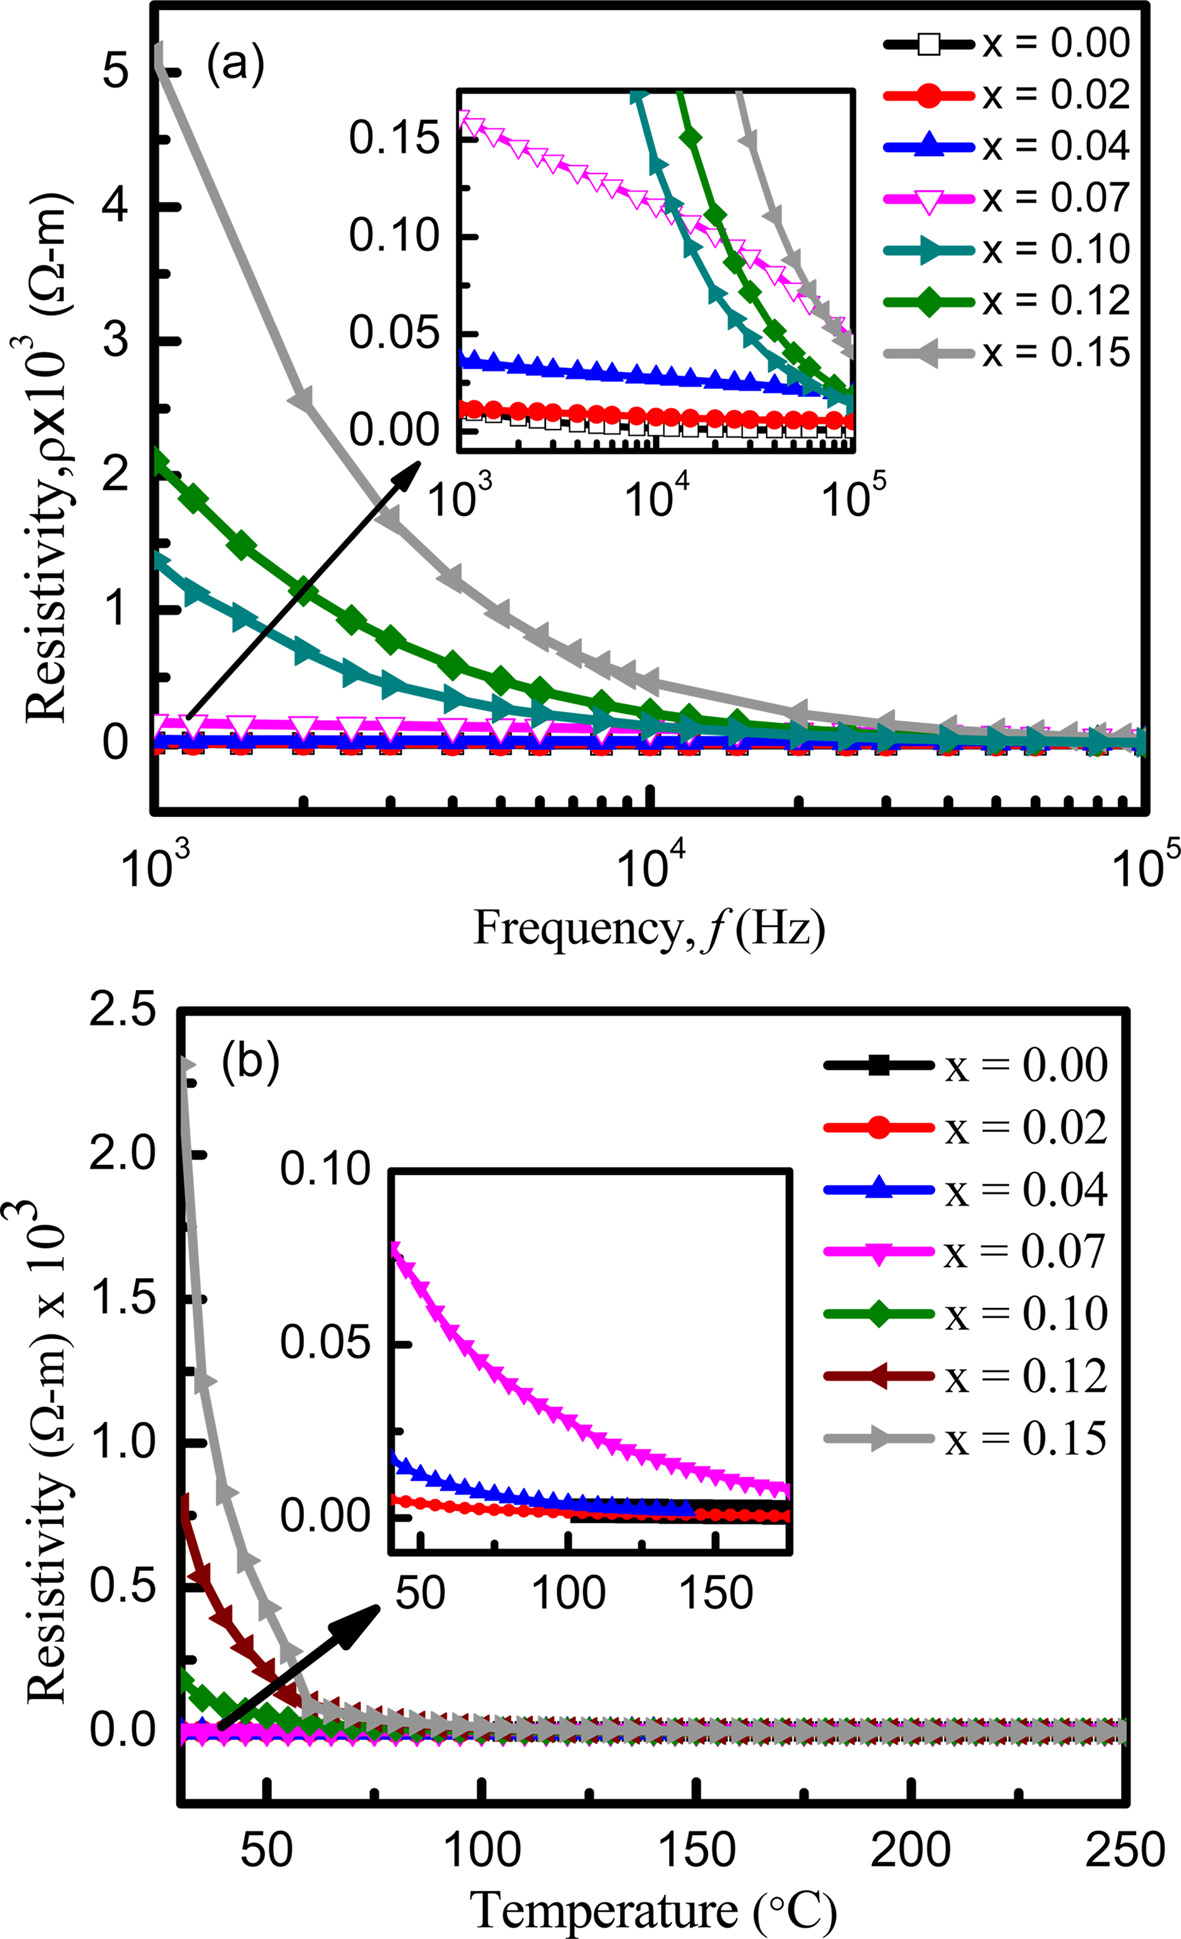
The AC resistivity of the samples is found to decrease with the increase of frequency as shown in Fig. 6(a). The increased frequency of the applied field may enhance the hopping of charge carriers resulting in an increase in the conduction process which in turn decreases the resistivity. On the other hand, the AC resistivity increases with the increase of Eu3+ concentration. Addition of Eu3+ ions reduces concentration of Fe3+ at B-site as Eu takes place at octahedral (B-site) sites by replacing Fe3+ ions [47]. The reduced concentration of Fe3+ at B-site may decrease the electron hopping rate. As a result, the AC resistivity improves with the increase of Eu ion concentration.
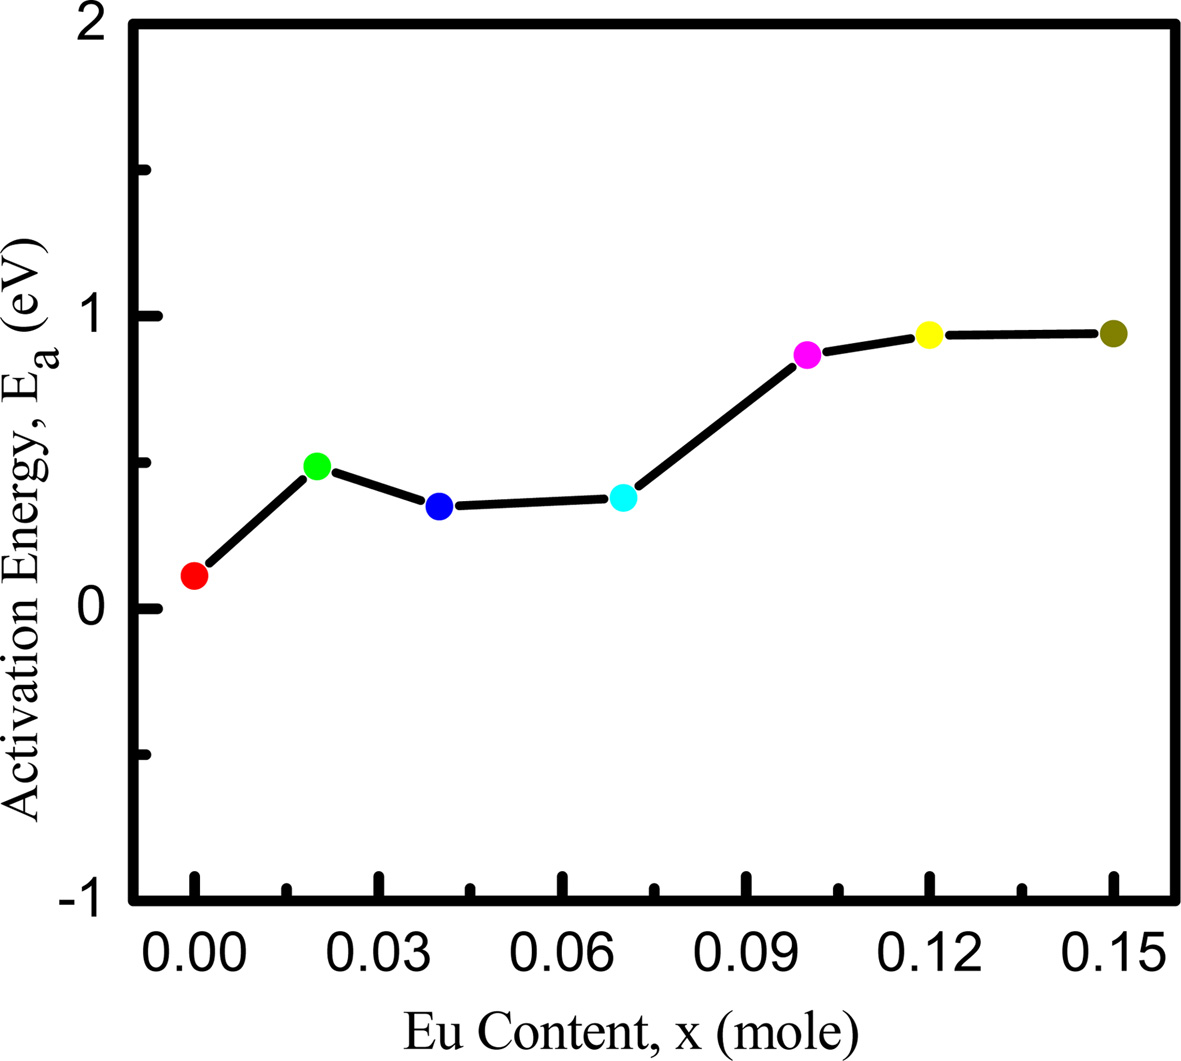
Fig. 6(b) shows that the resistivity decreases exponentially with the increase of temperature. Generally, the valance electrons jump to the conduction band at higher temperature. As a result, conductivity increases and resistivity decreases. The resistivity is also found to increase with the addition of Eu. It is conjectured that the occupation of Eu ions at B-sites might have lengthened Fe3+ and Fe2+ ions separation in proportion to the ionic radius and blocked the electron transfer between ions. The activation energies of the samples are also calculated using Arrhenius formula. From Fig. 7, activation energy is found to exhibit an increasing trend with the increase in Eu contents because of the enhancement of resistivity. These results are consistent with the previous work [48, 49].
Permeability measurement:
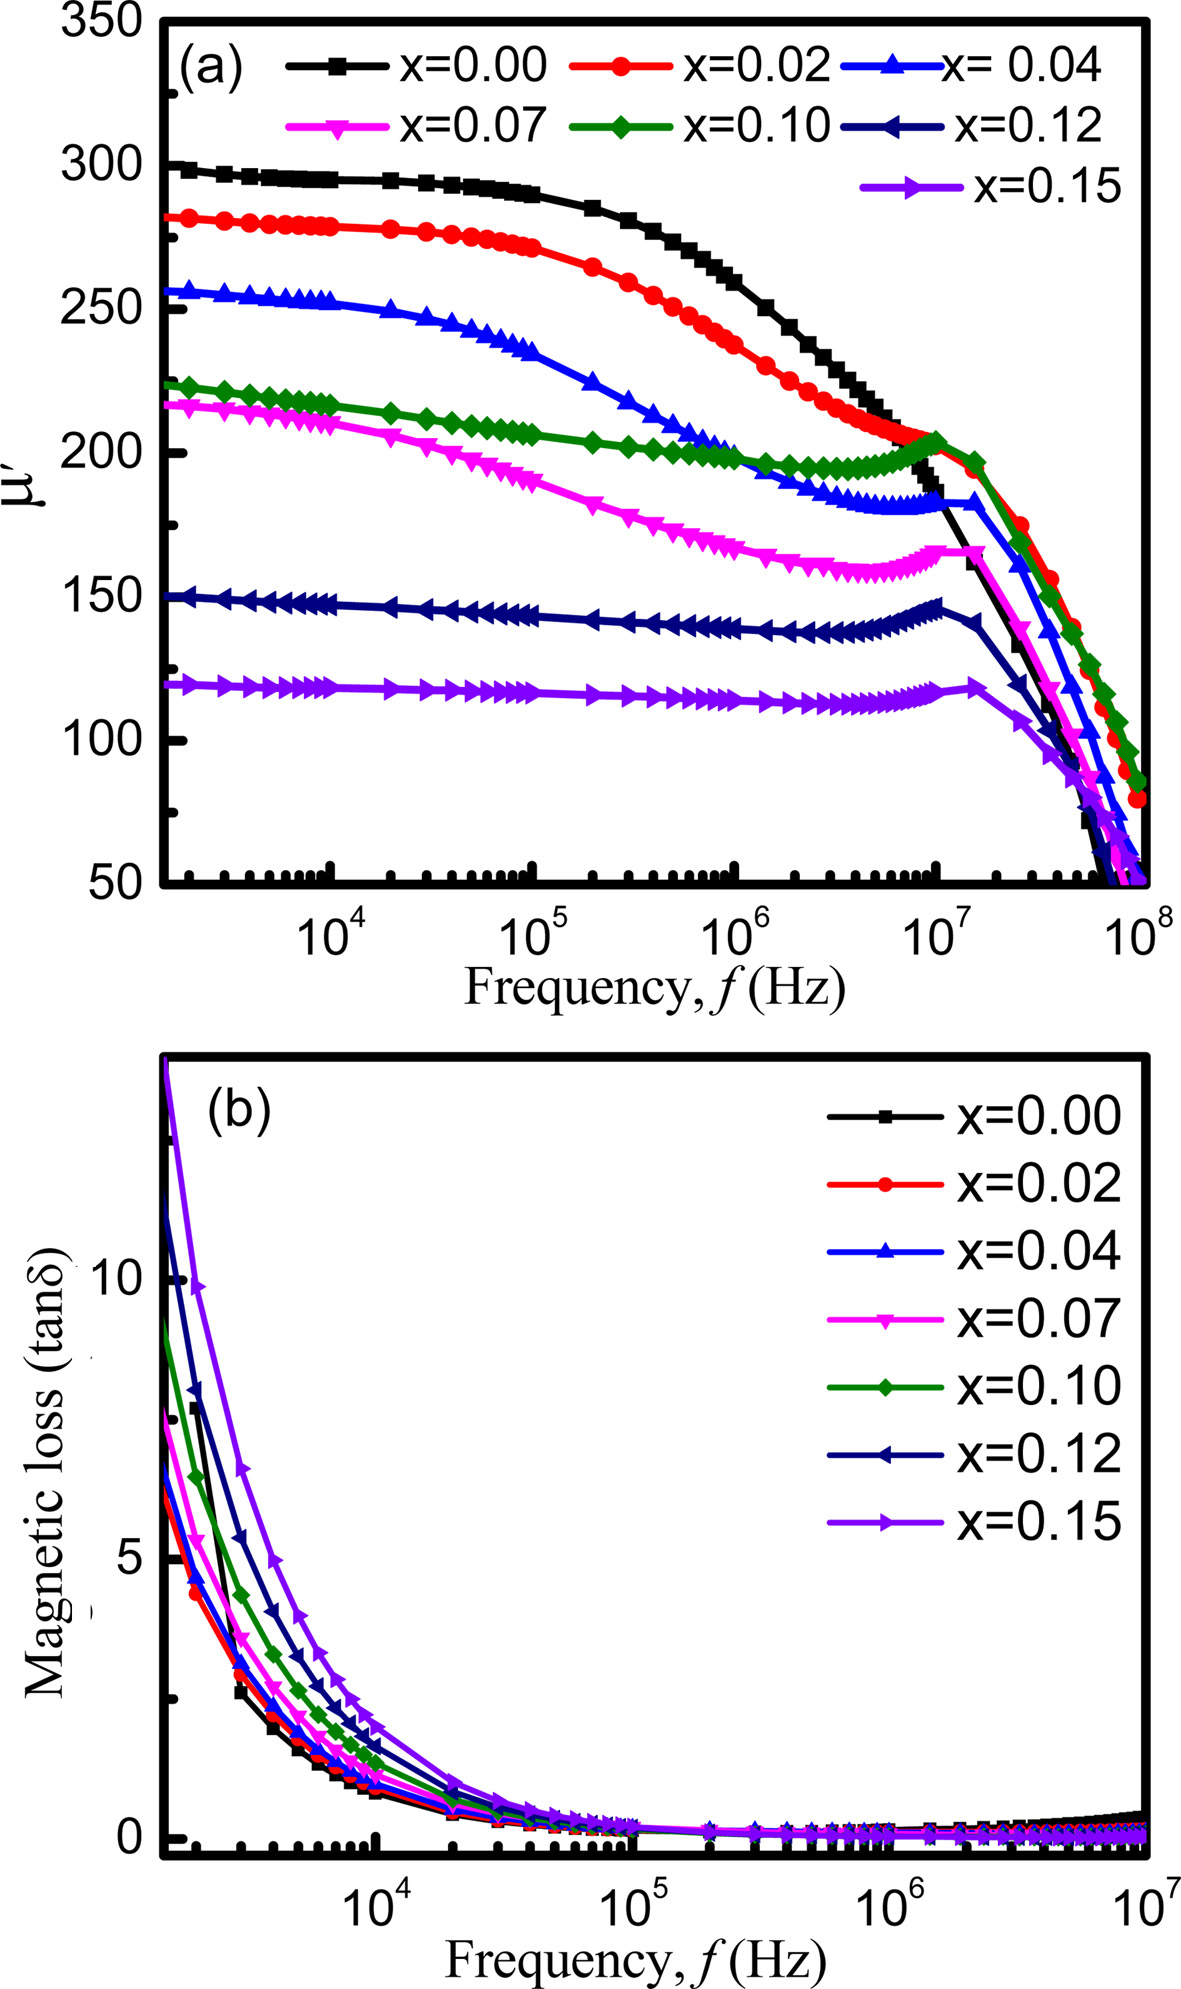
Fig. 8(a) shows the variation of initial permeability μ' as a function of frequency for x = 0.00 to x = 0.15 sintered at 1200 oC. It is noticed that samples exhibit high permeability at low frequency while at high frequencies the permeability is very low. The initial permeability decreases gradually with the increasing frequency from x = 0.00 to 0.07. According to K.H. Maria et al. [31], permeability of polycrystalline ferrites can be connected to two magnetizing mechanisms such as, domain wall motion and spin rotation. The reversible motion of domain walls mainly affects the initial permeability. Moreover, the permeability, resulted from the wall motion, is possible to linearly dependent on the grain size. On the other hand, contribution to permeability by spin rotation was considered to be independent of grain size. With the increasing frequency the domain wall motion predominates over the spin rotation. Hence, initial permeability decreases gradually with the increasing frequency. For x = 0.10 to 0.15, the initial permeability shows flat profile with the variation of frequencies indicating good low frequency stability. With the increasing Eu contents, the grain size may have decreased. The decreases in grain size possibly have resulted in the reduction of the domain wall from each grain. Besides, it is observed from Fig. 3 that the density increases with the decreasing porosity which in turn decreases the demagnetizing field. It also decreases the spin rotation. Consequently, the initial permeability may become independent of frequency upto certain frequency called as cut-off frequency. After cut-off frequency, nonmagnetic impurities between intra-granular pores may significantly reduce spin rotation and domain wall motion. As a consequence, permeability decreases at higher frequencies.
From Fig. 8(a) it is noticed that the initial permeability decreases with the increasing Eu content. Similar result is reported by M. Šoka et al. [50]. The super-exchange interaction among the cations of tetrahedral, A site and octahedral, B site dominates the magnetization of ferrites. Moreover, Neel model of ferrimagnetism [16] claimed that A-B exchange interactions predominate over other intra-sublattice A-A and B-B exchange interactions. When Eu3+ ions are added, they prefer to occupy B site by replacing Fe3+ ions from B- site to A- site. As a result, net magnetic moment of B- site reduces in comparison to that of A- site. Hence, magnetization decreases with the increasing Eu contents. The dependence of permeability on molecular magnetism is such that the force on a domain wall due to a magnetic field and the resultant change of magnetization are both proportional to permeability [39]. As a result, permeability decreases with Eu contents. The loss factor decreased dramatically for x = 0.02 but increased with further increasing Eu content as shown in Fig 8(b). The major contribution to the magnetic losses in ferrites can be explained by damping phenomenon associated with irreversible wall displacement and spin rotations. Domain wall defects are also responsible for the loss [40]. In the high frequency region the loss factor indicates very small values, which is one of the criteria for the materials to be used for high frequency applications such as microwave devices [51]. At high frequencies the loss is very low because of the lag of motion of domain wall corresponding to the applied alternating magnetic field.
Temperature dependent permeability
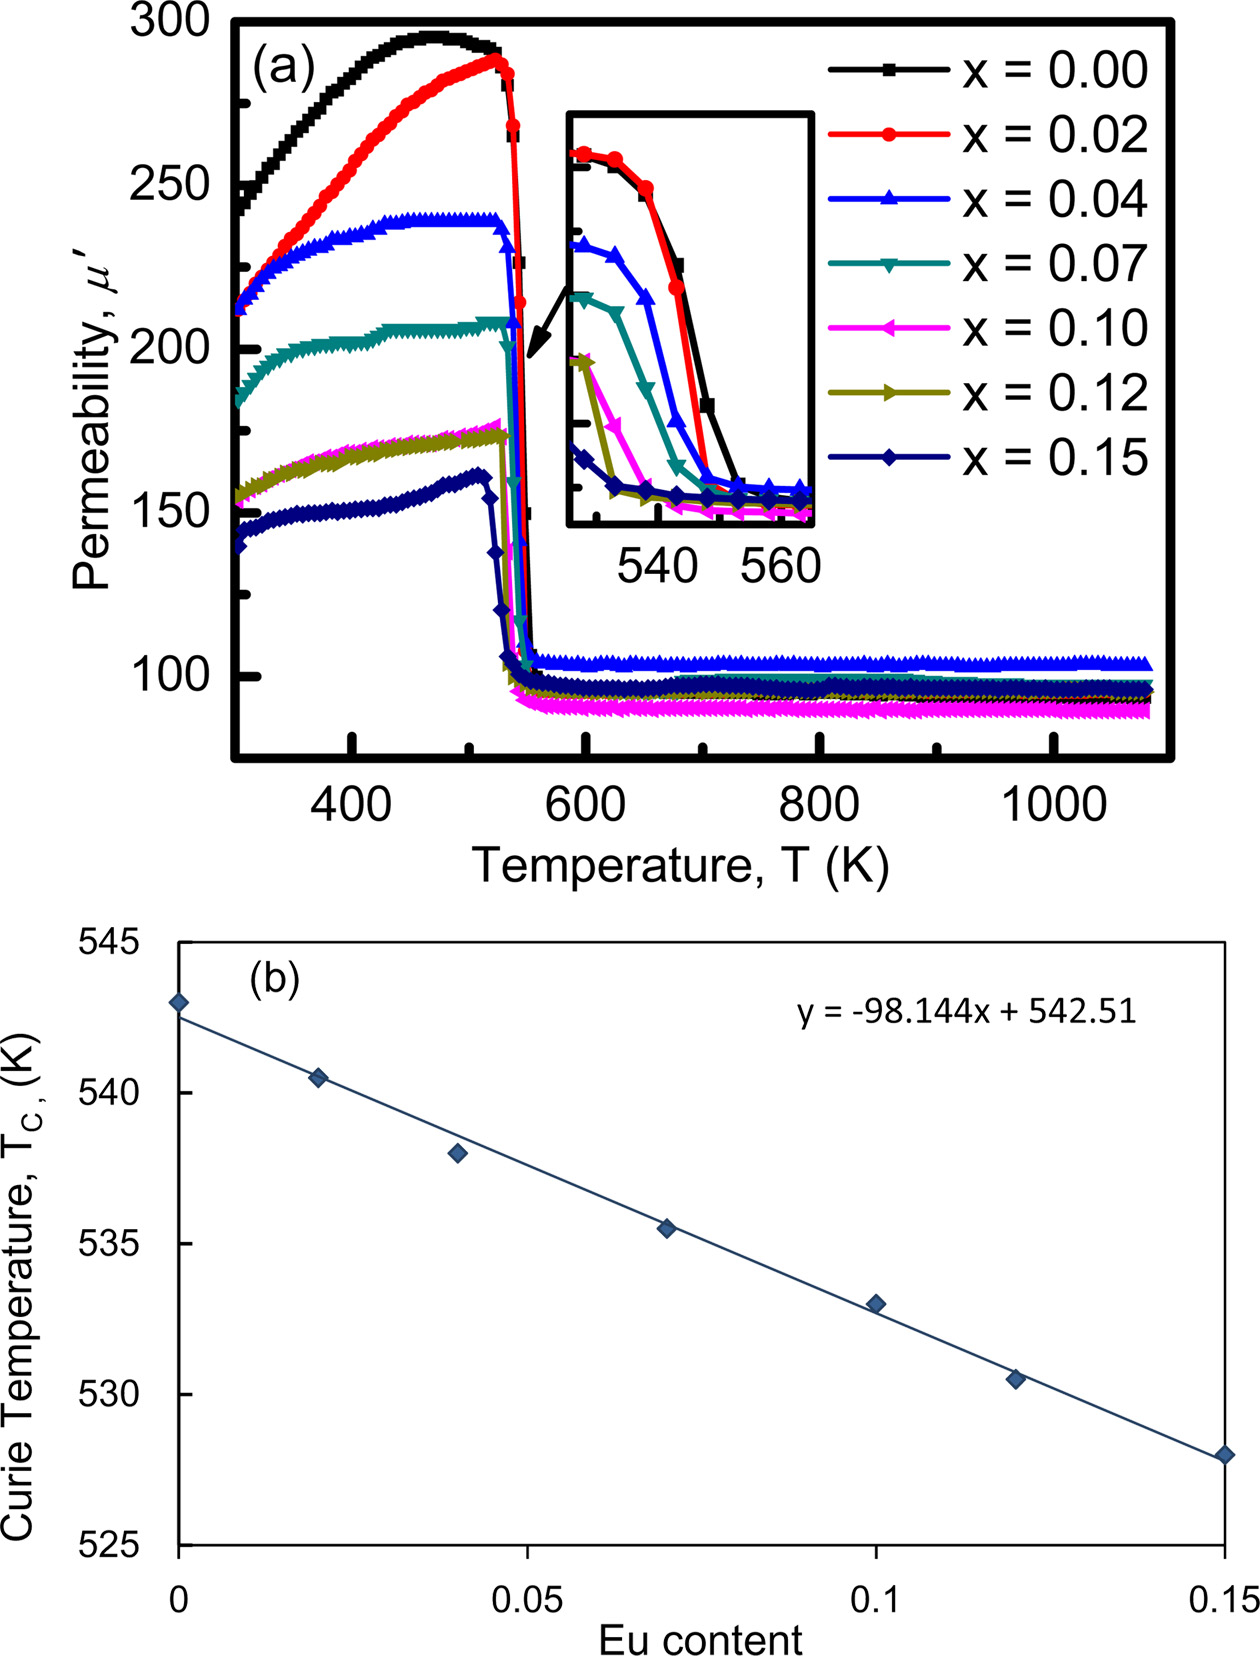
Curie temperature (TC) of a ferrite is the temperature at which a magnetically ordered (ferromagnetic) material no longer has the ordered form and becomes magnetically disordered (paramagnet). The dominance of the exchange interaction between the magnetic atoms is also indicated by the Curie temperature [52]. Curie temperature is measured at the sharp fall of the real part of permeability towards zero, where complete spin disorder takes place. To determine TC accurately, the maxima of imaginary part and the corresponding sharp fall of the real part of the permeability towards zero simultaneously should be determined.
Fig. 9(a) shows the variation of the initial permeability μ' with temperature of the sample where the imaginary component of the permeability μ" has not been shown for the clarity of the graph. It is noticed that μ' increases with increasing temperature attaining a maximum value just below TC which is a manifestation of Hopkinson peak attributed to the minimization of magneto crystalline anisotropy energy with temperature. Beyond this peak value of μ', permeability sharply falls to very low value indicating the ferro-paramagnetic phase transition (TC). The sharp fall of the permeability at the Curie point indicates the degree of homogeneity in the sample composition which has also been confirmed by X-ray diffraction [52, 40]. After the Curie point, μ' does not change with the increasing temperature, it becomes smaller and independent of temperature i.e. paramagnetic behavior. The increasing initial permeability with the increasing temperature for the NZCFEO ferrites can be described according to the Globus et al.[53],
Here, D indicates the average grain size, Ms stands for the saturation magnetization and κ1 denotes the anisotropy constant. It can be clearly understood that the permeability decreases with the decrease of grain size. From Fig. 9(a), the decrease of permeability is observed with the increase of Eu. It is conjectured that the increase may be related to the decrease of grain sizes. According to K.H. Maria et al., [52] the anisotropy constant generally reduces rapidly with temperature compared to the saturation magnetization which leads to the enhancement of μ'. Curie temperature (TC) is found to decrease with increasing concentration of Eu as shown in Fig. 9(b). Similar result has been seen in Sun et al. [11]. Because of the larger ionic radii of Eu, the lattice becomes distorted and this homogeneous distribution of composition may responsible for the degradation of permeability. As the rare earth Eu ions have a tendency to occupy octahedral B-site, the redistribution of Fe ions occur at both A and B sites. The Fe-Eu interaction after the substitution of Eu in place of Fe is much weaker than Fe-Fe interaction before the substitution. The weaker Fe-Eu interaction results in the decrease of the Curie temperature. A linear least square fitting of the Curie temperature with x, gives an empirical relation for the whole Ni0.4Zn0.45Cu0.15Fe(2-x)EuxO4 ferrites system as follows: TC(x) = TC(0) -98.144x, where TC(0) is the Curie temperature of the undoped Ni-Zn-Cu ferrite and TC(x) corresponds to the Curie temperature of any composition having Eu concentration, x. From this empirical relation Curie temperature of Ni0.4Zn0.45Cu0.15Fe(2-x)EuxO4 is found to be 542.51 K.
Magnetization measurement
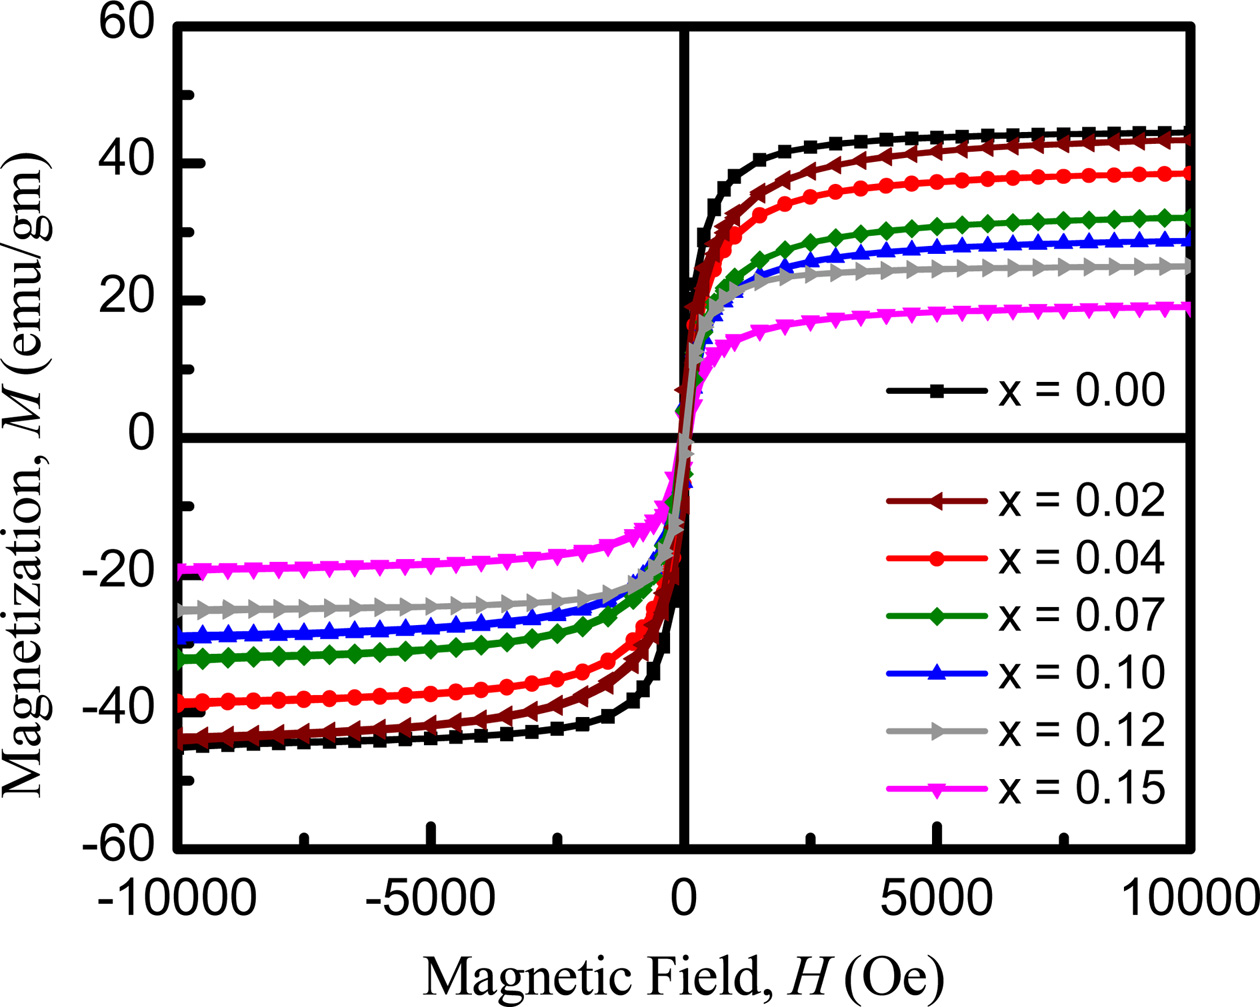
Fig. 10 shows the magnetization curves measured at room temperature with a VSM as a function of field to reach saturation value. The saturation magnetization value of a sample has been taken the magnetization at high field where M is independent of magnetic field. It is observed that magnetization decreases with Eu content up to x = 0.7 at room temperature and then increase. The initial decrease of magnetization with the increased Eu content is due to the decrease of resultant sublattice magnetic moment, which can be explained on the basis of Neel's two sublattice models.
Neel [32] considered three types of exchange interactions between unpaired electrons of two ions lying A-and B-sites. A-B interaction heavily predominates over A-A and B-B interactions. The A-B interaction aligns all the magnetic spins at A-sites in one direction and those at B-site in the opposite direction. The net moments of B and A sublattices, i.e., M = MB-MA [54-56]. Magnetic moment of any composition depends on the distribution of Fe3+ ion between A-and B-sites. Usually Fe3+ ion equally distributed between the tetrahedral (A) and octahedral (B) sites with magnetic moment of 5mB [57]. Zn2+ occupies the A-site as it has zero magnetic moment. Ni2+ prefers to occupy the B-site with higher magnetic moment of 2 mB compare to Cu2+ ions while Cu2+ goes to A site with magnetic moment of 1 mB. The replacement of x amount of Eu3+ ions prefer to replace Fe3+ can give rise to (1-x) Fe3+ ions on B-sites and (1+x) Fe3+ ions on A-sites and all the substituted Eu3+ expected to occupies B-sites with magnetic moment of 3.5 mB. In such a situation A-site becomes stronger and A-B exchange interaction becomes weaker which in turn decreases the magnetization. Trivalent Eu introduce magnetic moments associated with the uncompensated spin of 4f electrons into the spinel ferrite which may causes the Fe3+-Eu3+ interaction and magnetization may subsequently decreased [53].
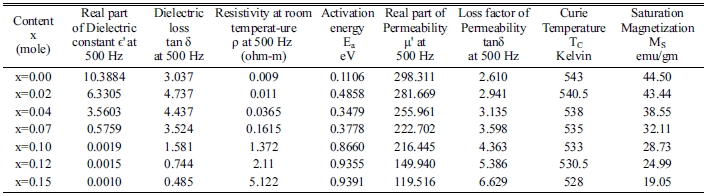
Saturated magnetization (Ms) depends on the defects, strains, non-magnetic atoms in the materials. From the M-H curve, the saturated magnetization is observed to decreases with Eu content. This behavior is consistent with the value of the density. The measured magnetizations are in good agreement with the above reported permeability results. The obtained dielectric parameters, resistivities, activation energies, permeability and curie temperatures etc. are summurized in Table 1 with the variation of Eu concentrations.
|
Fig. 1 X-ray diffraction peaks of NZCFEO with x = 0.00, 0.02, 0.04, 0.07, 0.10, 0.12, 0.15 ferrites sintered at 1200 oC for 3 h. |
|
Fig. 2 Variation of lattice parameter of Ni0.4Zn0.45Cu0.15Fe(2-x)EuxO4 ferrites as a function Eu concentrations. |
|
Fig. 3 Variation of X-ray, ρx and bulk density, ρB and porosity with the variation of Eu concentrations in NZCFEO. |
|
Fig. 4 SEM images NZCFEO ferrites with x = 0.00, 0.02, 0.04, 0.07, 0.10, 0.12, 0.15 with 10000 magnification at 20 kv. |
|
Fig. 5 Variation of (a) real dielectric constant, ε' and (b) dielectric loss, tan δ with frequency. |
|
Fig. 6 Variation of resistivity with increasing (a) frequency and (b) temperature. |
|
Fig. 7 Activation energy variation with Eu concentration in NZCFEO. |
|
Fig. 8 Variation of (a) initial permeability, μ' and (b) loss factor, tan d with increasing frequency. |
|
Fig. 9 (a) Permeability vs temperature for different compositions of Ni0.4Zn0.45Cu0.15Fe(2-x)EuxO4 ferrites and (b) variation of Curie temperature, TC as a function of Eu concentration. |
|
Fig. 10 Magnetization curve measured at 300 K as a function of field of Ni0.4Zn0.45Cu0.15Fe(2-x)EuxO4 ferrites sintered at 1200 oC for 3 h. |
The synthesized Ni0.4Zn0.45Cu0.15Fe(2-x)EuxO4 samples were single phase spinel structure as confirmed by X-ray diffraction. The lattice parameter increases with increasing Eu content due to the larger ionic radii of Eu. The bulk density increases with increasing concentration of Eu indicating better crystallization. The increasing bulk density has influenced the decrease of porosity with increasing europium. The X-ray density is larger than bulk density because of the porosity produced during the sintering process. The frequency dependent dielectric constant decrease with the increase of Eu. AC resistivity and DC resistivity shows increasing trend with the increasing concentration of substituted Eu. Permeability decreases with the increasing non-magnetic Eu content. The Curie temperature decreases almost linearly with europium substitution due to weakening of JAB super exchange interactions. Progressive decrease of magnetization with increasing Eu content is observed and is attributed to the reduction of Fe3+ ions on the B-sites.
The authors acknowledge gratefully to Materials Science Division, Atomic Energy Centre, Dhaka and Centre for Advanced Research of Sciences, University of Dhaka, Dhaka, Bangladesh.
- 1. M.P. Reddy, I.G. Kim, D.S. Yoo, W. Madhuri, N.R. Reddy, K.V.S. Kumar, and R.R.K. Reddy, Mater. Sci. Appl. 3[9] (2012) 628-632.
-

- 2. S.G. Bacchav, R.S. Patil, P.B. Ahirrao, A.M. Patil, and D.R. Patil, J. Mater. Chem. Phys. 129[3] (2011) 1104-1109.
-
- 3. A. Hagfeldth and M. Gratzel, Chem. Rev. 95[1] (1995) 49-68.
-
- 4. S. Prasad and N.S. Gajbhiye, J. Alloy. Compd. 265[1-2] (1998) 87-92.
-
- 5. B.S. Randhawa and K. Sweety, Bull. Mater. Sci. 23[4] (2000) 305-307.
-
- 6. N. Rezlescu and E. Rezlescu, Solid State Commun. 88[2] (1993) 139-141.
-
- 7. N. Rezlescu, E. Rezlescu, C. Pasnicu, and M. L. Craus, J. Phys. Cond. Matter 6[29] (1994) 5707-5716.
-
- 8. J. Jing, L. Liang-Chao, and X. Feng, J. Rare Earths. 25[1] (2007) 79-83.
-
- 9. L.G. Van Uitert, J. Chem. Phys. 23[10] (1955) 1883-1887.
-
- 10. C.B. Kolekar, P.N. Kamble, S. G. Kulkarni, and A.S. Vaingankar, J. Mater. Sci. 30[22] (1995) 5784-5788.
-
- 11. G. L. Sun, J. B. Li, J. J. Sun, and X. Z. Yang, J. Magn. Magn. Mater. 281[2-3] (2004) 173-177.
-
- 12. M.A. Iqbal, Misbah-ul-Islam, I. Ali, H.M. Khan, and G. Mustafa, I. Ali, Ceram. Int. 39[2] (2013) 1539-1545.
-
- 13. E. Ušák, M. Ušáková, M. Šoka, and D. Vašut, Acta. Phys. Pol. A 131[4] (2017) 717-719.
-
- 14. M. Šoka, M. Ušáková, E. Ušák, R. Dosoudil, and J. Lokaj, IEEE Trans. Magn. 50[4] (2014) 1-4.
-
- 15. W.J. Nellis, S. Legvold, Phys. Rev. 180[2] (1969) 581-590.
-
- 16. A. Zubair, Z. Ahmad, A. Mahmood, W.C. Cheong, I. Ali, M.A. Khan, A.H. Chughtai, and M.N. Ashiq, Res. Phys. 7 (2017) 3203-3208.
- 17. S.E. Jcoba, S. Dukalde, and H.R. Bertorella, J. Magn. Magn. Mater. 272 (2004) 2253-2254.
-
- 18. R.S. Devan, C.M. Kanamadi, S.A. Lokare, and B.K. Chougule, Smart Mater. Struct. 15[6] (2006) 1877-1881.
-
- 19. K.I. Kugel and D.I. Khomskii, Sov. Phys. Uspekhi 25[4] (1982) 231-256.
-
- 20. Z. He, J. Ma, Ceram. Int., 27[3] (2001) 261-264.
-
- 21. E.A. Vasilyeva, L.V. Morozova, A.E. Lapshin, and V.G. Kanakov, Mater. Phys. Mech., 5 (2002) 43-48.
-
- 22. W. Ran, H.M. Noh, S.H. Park, B.K. Moon, J.H. Jeong, and J.H. Kim, J. Shi, Scientific Reports, 8:5936 (2018) 1-9.
-
- 23. M.F. Al-Hilli, S. Li, and K.S. Kassim, Mater. Sci. Eng. B 158[1-3] (2009) 1-6.
-
- 24. P.C. Sati, M. Kumara, S. Chhoker, and M. Jewariy, Ceram. Int. 41[2] (2015) 2389-2398.
-
- 25. R.K. Singh and A. Narayan, Int. J. Eng. Tech. Res. 2[8] (2014) 125-130.
- 26. S. Xavier, R.M. Sebastian, and E.M. Mohammed, Int. J. Eng. Sci. Innov. Technol. 4[5] (2015) 125-133.
-
- 27. A. Khan, M.A. Bhuiyan, G.D. Al-quaderi, K.H. maria, S. Choudhury, K.M.A. Hossain, S. Akther, and D.K. Saha, J. Bangladesh Acad. Sci. 37[1] (2013) 73-82.
-
- 28. L. Vegard, Z. Phys. 5[1] (1921) 17-26.
-
- 29. J.F. Shackelford, Y.H. Han, S.Kim, and S.H. Kwon, CRC Materials Science and Engineering Handbook, fourth edition, London, New York, CRC Press, pp: 1-338, 2015.
-
- 30. J.R. De Laeter, J.K. B?hlke, P. De Bi?vre, H. Hidaka, H.S. Peiser, K.J.R. Rosman, and P.D.P. Taylor, Pure Appl. Chem. 75[6] (2003) 683-800.
-
- 31. M.A. Hakim, S.K. Nath, S.S. Sikder, and K.H. Maria, J. Phys. Chem. Solids 74[9] (2013) 1316-1321.
-
- 32. A.A. Sattar, H.M. El-Sayed, K.M. El-shookrofy, and M.M. EI-Tabey, J. Appl. Sci. 5[1] (2005) 162-168.
- 33. K.H. Maria, S. Choudhury, and M.A. Hakim, Int. Nano Lett. 3[1] (2013) 1-10.
-
- 34. M.R. Anantharaman, S. Sindhu, S. Jagatheesan, K.A. Malini, and P. Kurian, J. Phys. D: Appl. Phys. 32[15] (1999) 1801-1810.
-
- 35. I.N. Esha, F.T.Z. Toma, Md. Al-Amin, M.N.I. Khan, and K.H. Maria, AIP Adv. 8[12] (2018) 125207
-
- 36. K.W. Wagner, Ann. Phys. (Leipzig) 345[5] (1913) 817-855.
-
- 37. K. Iwauchi, Jpn. J. Appl. Phys 10[11] (1971) 1520-1528.
-
- 38. C.G. Koops, Phys. Rev. 83[1] (1951) 121-124.
-
- 39. K.H. Maria, S. Choudhury, and M.A. Hakim, J. Bangladesh Acad. of Sci. 341[1] (2010) 1-8.
-
- 40. K.H. Maria, S. Choudhury, and M.A. Hakim, Int. J. Phys. Appl. 3[1] (2011) 23-32.
-
- 41. U.N. Trivedi, M.C. Cchantbar, K.B. Modi, and H.H. Joshi, Indian J. Pure & Appl. Phys. 43 (2005) 688-690.
- 42. M.R. Shah and A.K.M. Akther Hossain, Mater. Sci.-Poland 31[1] (2013) 80-87.
-
- 43. K.K. Bharathi and C.V. Ramana, J. Mater. Res. 26[4] (2011) 584-591.
-
- 44. I.H. Gul and A. Maqsood, J. Magn. Magn. Mater. 316[1] (2007) 13-18.
-
- 45. A.A. Kadam, S.S. Shinde, S.P. Yadav, P.S. Patil, and K.Y. Rajpure, J. Magn. Magn. Mater. 329 (2013) 59-64.
-
- 46. K. Chakrabarti, K. Das, B. Sarkar, and S.K. De, J. Appl. Phys. 110[103905] (2011) 1-10.
-
- 47. M.A. Ahmad, N. Okasha, and L. Salah, J. Magn. Magn. Mater. 264[2-3] (2003) 241-250.
-
- 48. S.E. Jacobo, W.G. Fano, and A.C. Razzitte, Physica B 320[1-4] (2002) 261-263.
-
- 49. G.L. Sun, J.B. Li, J.J. Sun, and X. Zhan, J. Magn. Magn. Mater. 281[2-3] (2004) 173-177.
-
- 50. M. Šoka, M. Ušáková, E. Ušák, R. Dosoudil, and J. Lokaj, IEEE Trans. Magn. 50[4] (2014) 1-4.
-
- 51. J. Chand, G. Kumar, P. Kumar, S.K. Sharma, M. Knobel, and M. Singh, J. Alloy. Compd., 509[40] (2011) 9638-9644.
-
- 52. M.M. Haquea, K.H. Maria, S. Choudhury, M.A. Bhuiyan, and M.A. Hakim, J. Ceram. Process. Res. 14[1] (2013) 82-86.
- 53. A. Globus, H. Pascard, and V.J. Cagan, J. Physique 38 (1977) C1-163-168.
-
- 54. S. Noor, M.A. Hakim, S.S. Sikder, S.M. Hoque, K.H. Maria, and P. Nordblad, J. Phys. Chem. Solids 73[2] (2012) 227-231.
-
- 55. K.H. Maria, S. Choudhury, and M.A. Hakim, Dhaka Univ. J. Sci. 58[1] (2010) 105-108.
- 56. F.T.Z. Toma, I.N. Esha, Md. Al-Amin, M.N.I. Khan, and K.H. Maria, J. Ceram. Process. Res. 18[10] (2017) 701-710.
- 57. A. Verma, T.C. Goel, R.G. Mendiratta, and M.A. Alam, Mater. Sci. Eng.: B 60[2] (1999) 156-162.
-
- 58.
 This Article
-
2019; 20(5): 530-539
- 10.36410/jcpr.2019.20.5.530
Services
- Abstract
introduction
experimental techniques
results and discussion
conclusions
acknowledgement
- References
- Full Text PDF
Shared
Correspondence to
- Kazi Hanium Maria
-
Department of physics, University of Dhaka, Dhaka-1000, Bangladesh
Tel : +880-2-01711987595
Fax: +880-2-8615583 - E-mail: kazimaria@du.ac.bd
Clean-Energy Research Institute(CRI), Hanyang University, 222, Wangsimni-ro, Seongdong-gu, Seoul, 04763, Korea
E-mail: jcpr@hanyang.ac.kr