


- Dosimetric properties of Mg-doped Al2O3 transparent ceramics
Takumi Kato*, Noriaki Kawaguchi, and Takayuki Yanagida
Nara Institute of Science and Technology (NAIST), 8916-5, Takayama-cho, Ikoma-shi, Nara 630-0192, Japan
Transparent ceramics of Al2O3 doped with different concentrations of Mg2+ ions (0.001, 0.01, 0.1 and 1.0%) were synthesized by the Spark Plasma Sintering (SPS) method, and scintillation and dosimetric properties were investigated. Under X-ray irradiation, all the samples showed emission peaks around 310, 380 and 693 nm. Based on the measured scintillation decay times and previous studies, the origins of the emission peaks at 310, 380 and 693 nm were attributed to F+ centers, F centers and Cr3+ impurity ions, respectively. The 0.1% Mg-doped sample showed a glow curve consisting of peaks around 50, 105, 135, 230, 350 and 400 oC. All the samples had a linear TSL response in a dose range from 0.1 to 1,000 mGy.
Keywords: Transparent ceramic, Al2O3, dosimeter
Phosphors are used as dosimeters for personal and environmental monitoring applications and in imaging plates [1-3]. These materials possess a function to store and accumulate absorbed energy of ionizing radiations as a form of trapped electrons and holes. The electrons and holes are stored at localized trapping centers, and they recombine to emit a light after de-trapping process by external stimulation. Dosimeters based on phosphors are mainly classified into three categories on different luminescence mechanism. One is thermally stimulated luminescence (TSL), which is observed by recombination of electrons and holes de-trapped from trapping centers by heat stimulation. Another is optically stimulated luminescence (OSL) in which the stimulation is performed by light, instead of heat in TSL. The last one is radio-photoluminescence (RPL) which is a phenomenon which generates photoluminescence (PL) centers via interactions with radiations.
In general, suitable sensitivity, dose linearity, energy response and low fading are required for dosimetric properties which depend on applications. Moreover, if the aim is to measure a radiation dose absorbed in human body, it is preferred that the effective atomic number (Zeff) of the dosimetric material is close to that of the soft tissue (Zeff = 7.13) from the view point of bioequivalence. Against such a tissue equivalent detector, no mathematical calibrations for energy dependence is required ideally. Therefore, for such dosimeter applications especially in protection dosimetry, it is desirable that the detector materials are composed of light elements. In fact, commercial personal dosimeters are equipped with phosphors possessing low Zeff; for example, there are LiF:Mg, Ti, CaF2:Tm and CaSO4:Dy used as TSL dosimeter [4], BeO used as OSL dosimeter [5] and Ag-doped phosphate glass used as RPL dosimeter [6].
Aluminum oxide (Al2O3) has been investigated as a phosphor for use in personal dosimetry due to its chemical stability, thermal stability and low effective atomic number close to the soft tissue. Presently, Al2O3 doped with carbon (Al2O3:C) crystals as TSL and OSL dosimeters are well-established in personal dosimetry, and it has been available as a commercial product for almost two decades [7-10]. Furthermore, C and Mg co-doped Al2O3 having RPL property is currently used as a fluorescent nuclear track detector in the dosimetry of neutrons, heavy charged particles and energetic protons [11]. It is considered that carbon and magnesium ions play a role to enhance defect creations for main emission centers in Al2O3. On the other hand, with advancement of ceramic fabrication techniques, it was reported that Al2O3 can be synthesized in a form of transparent ceramics [12, 13]. However, these reports did not deal with the applications for personal radiation monitors. In comparison with single crystals, ceramic dosimeters are considered to have distinct advantages because a large number of defect centers is included which enhance the dosimetric properties [14, 15].
In this study, we synthesized Al2O3 transparent ceramics doped with Mg ions (0.001, 0.01, 0.1 and 1.0%) by the spark plasma sintering (SPS) method and investigated the dosimetric properties against X-rays. Further, we also studied their scintillation properties in order to revel origins of emission centers. In general, SPS is performed in a highly reductive environment; therefore, oxygen vacancies are effectively generated, and radiation response properties of transparent ceramic are expected to be enhanced compared with those of single crystal. Such effects were observed in different material systems and reported elsewhere [14-19].
Al2O3 transparent ceramics doped with Mg ions (0.001, 0.01 0.1 and 1.0%) were fabricated by the SPS technique using Sinter Land LabX-100. Al2O3 (99.99%) and MgO (99.99%) powders of reagent grade were homogeneously mixed. The 0.5 g of the mixture was loaded in a graphite die and held between two graphite punches. A sintering condition consists of three steps. First, the temperature was elevated from 25 to 600 ℃ in 5 min. Next, the temperature was slowly increased from 600 to 850 ℃ at a rate of 10 ℃/min and held for 10 min while applying a pressure of 70 MPa. Finally, the temperature was further increased from 850 ℃ to 1,300 ℃ at the rate of 10 ℃/min and kept at 1,300 ℃ for 20 min while applying 70 MPa pressure. After the synthesis, the wide surfaces of the obtained sample were mechanically polished with a polishing machine (MetaServ 250, BUEHLER).
Optical in-line transmittance spectra were measured by a spectrometer (V670, JASCO) over a spectral range from 190 to 2,700 nm with 1 nm intervals. In order to identify origins of emission centers, we investigated X-ray induced scintillation properties. First, we measured scintillation spectra using our lab-constructed setup. A sample was irradiated by X-rays generated by an X-ray tube in which the applied tube voltage and current were 40 kV and 5.2 mA, respectively. The scintillation emission was guided to a CCD-based spectrometer (Andor DU-420-BU2 or Ocean Optics QEPro depending on the spectral range) to measure the spectrum. Details of the setup were described previously [20]. Second, we evaluated X-ray induced scintillation decay time constants using an afterglow characterization system equipped with a pulse X-ray tube [21]. The system is commercially available from Hamamatsu as a custom-ordered instrument. The applied voltage to the pulse X-ray source was 30 kV, and the system offers the time resolution of ~1 ns.
In order to evaluate TSL properties of the Mg-doped Al2O3 transparent ceramics, we measured TSL glow curves using a Nanogray TL-2000 [22] after X-ray irradiations with various doses from 0.1 to 1,000 mGy. The heating rate was fixed to 1 ℃/s for all the glow curve measurements, and the measurement temperature range was from 50 to 400 ℃. Moreover, TSL spectra were measured using the CCD-based spectrometer (QE Pro, Ocean Optics) while the sample was heated by an electric heater (SCR-SHQ-A, Sakaguchi E.H Voc) at a constant temperature.
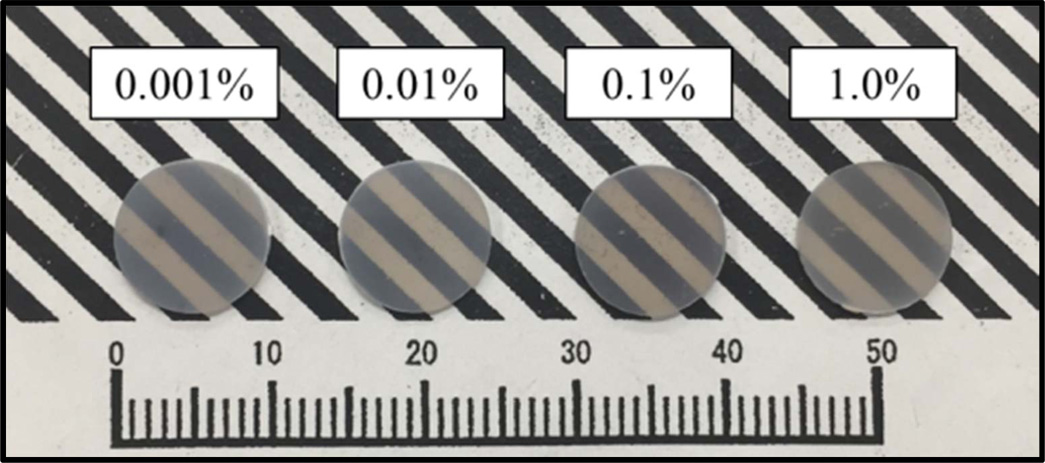
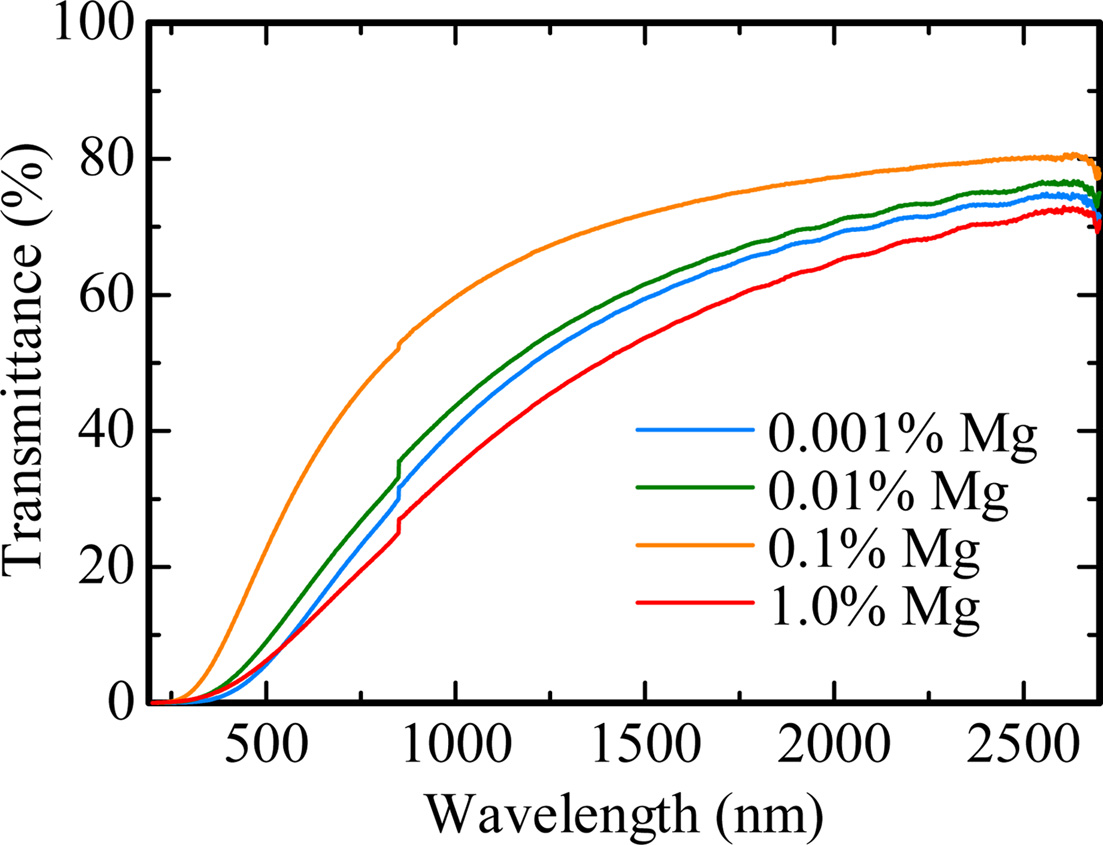
Fig. 1 shows the obtained Al2O3 transparent ceramic samples doped with Mg (0.001, 0.01, 0.1 and 1.0%) under room light. The thicknesses of the 0.001, 0.01, 0.1 and 1.0% Mg-doped samples are 0.72, 0.67, 0.75 and 0.75 mm, respectively. These samples are visually transparent, and the black stripe patterns on the back were clearly seen. Fig. 2 indicates the in-line transmittance spectra from 190 to 2,700 nm of all the samples. No particular absorption bands due to unexpected contaminations were confirmed in all the samples. The transmittance increases from 0 to 70% with an increase of wavelength in the spectral range of 300-2,700 nm. These characteristics are a typical for Mie scattering. The transmittance of 0.1% Mg-doped sample was highest among the present samples. Moreover, the transmittance increased with the dopant concentration from 0.001 to 0.1%. These results imply that the dopant of MgO act as a sintering assistant in Al2O3 transparent ceramic.
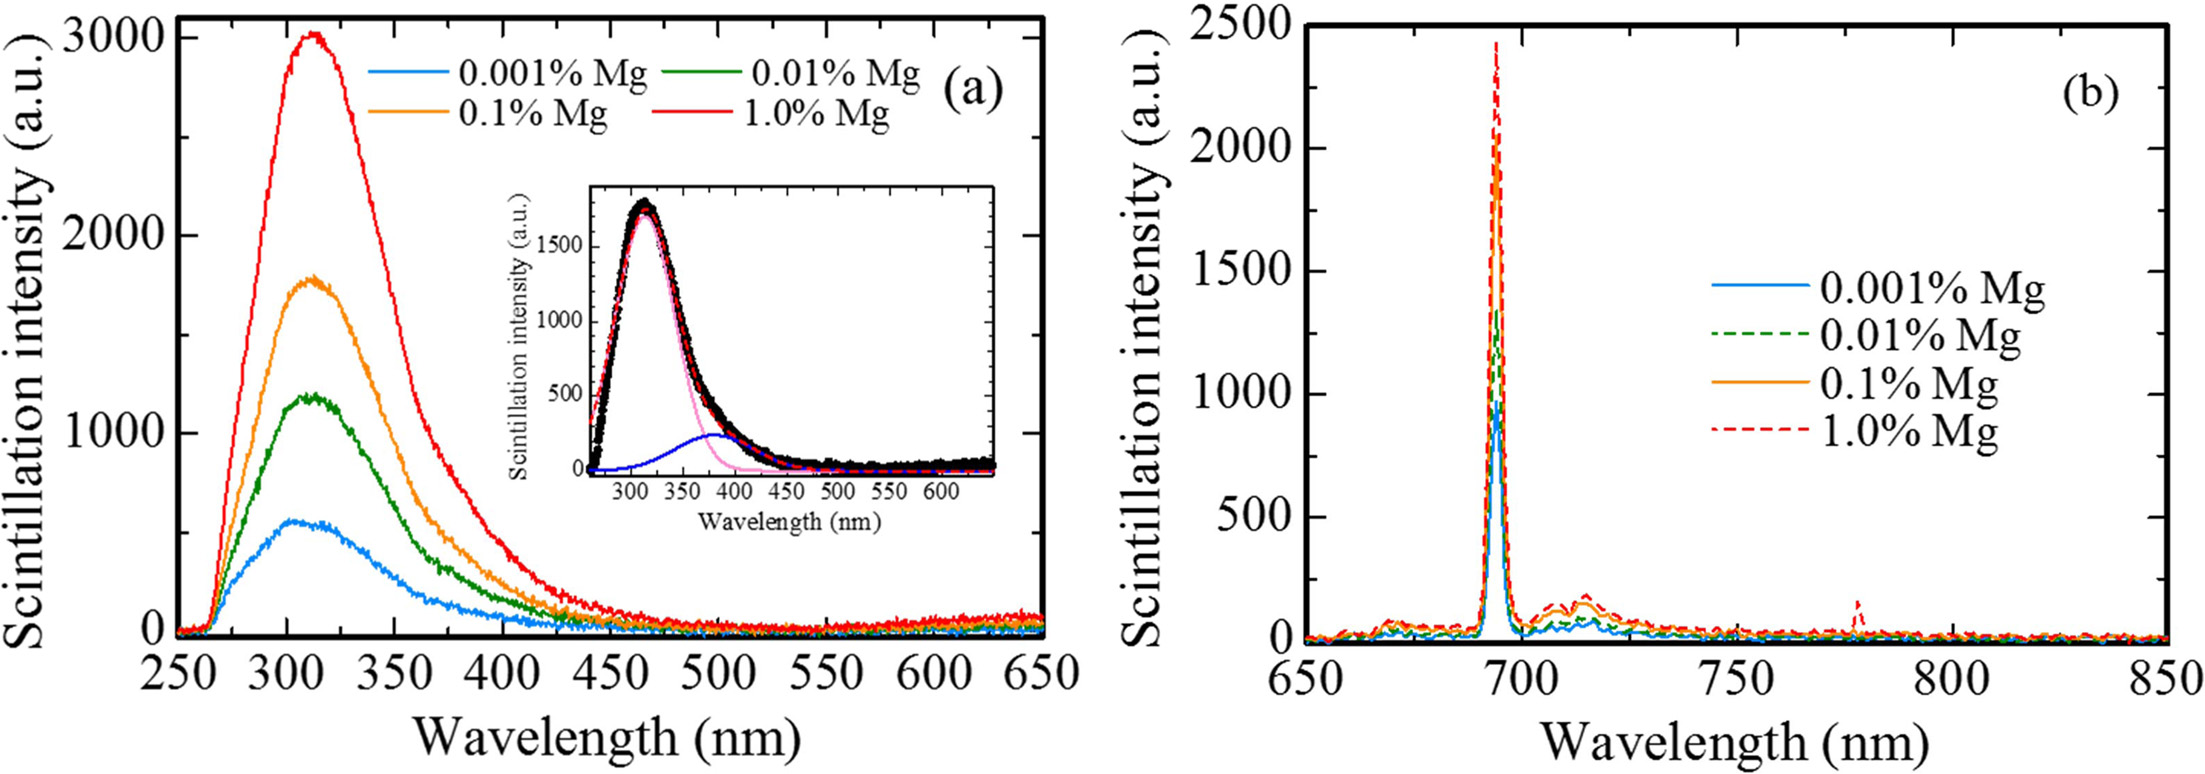
X-ray induced scintillation spectra of all the samples are shown in Fig. 3. All the samples showed emission peaks around 310, 380 and 693 nm. These peak wavelengths are consistent with the ones in previous study [23-25]; therefore, it is considered that the origins of the emission peaks at 310, 380 and 693 nm are due to F+ centers, F centers and Cr3+ ions impurity, respectively. The scintillation intensities of each peak increased with increasing the dopant amount. Regarding the emission peaks at 310 and 380 nm, it is thought that MgO doping assisted to generate F+ and F centers in Al2O3 for charge compensation between Al3+ and Mg2+ ions. Furthermore, it is well-known to that MgO raw powder includes a few of Cr3+ ion impurity. Thus, with an increase of dopant amount, the scintillation intensity of the peak due to Cr3+ ions increased.
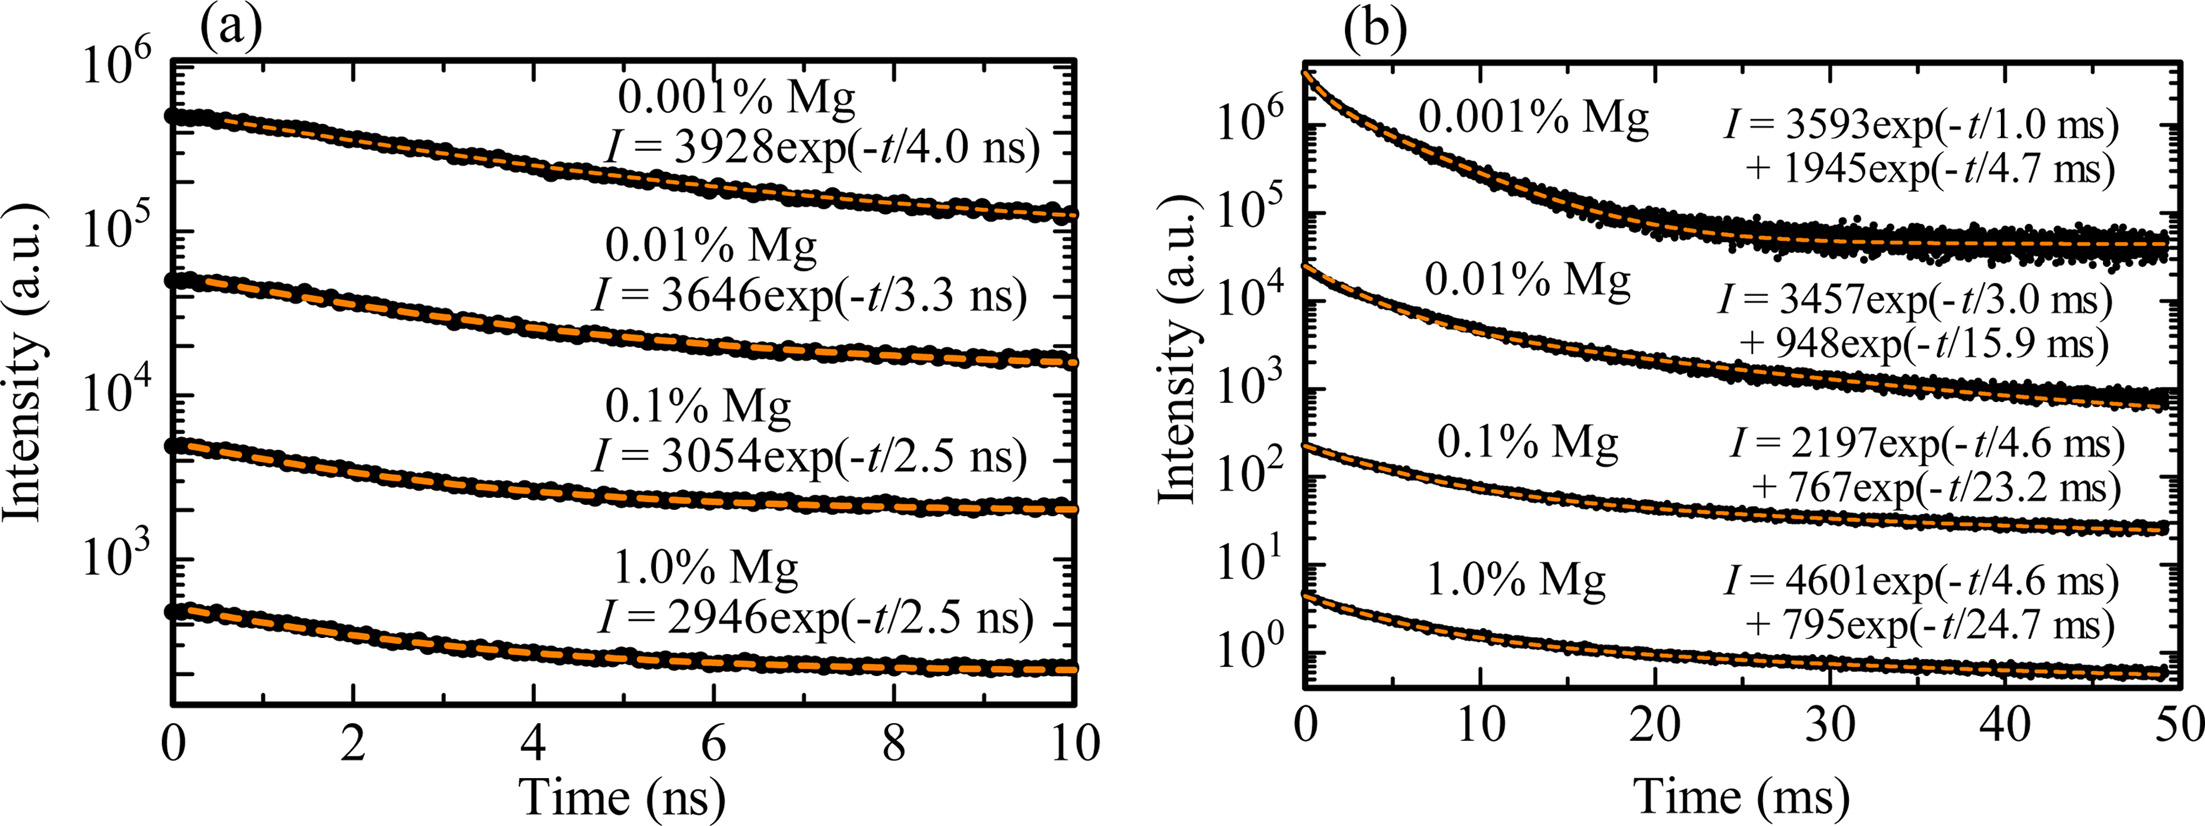
Subsequently, scintillation decay curves were measured in order to confirm to whether correct or not above assignments. Fig. 4 shows the scintillation decay curves of all the samples in the nano-second (ns) and millisecond (ms) range. The decay curves measured in the ns range were fitted by an exponential decay function (indicated in the figure). The obtained decay time constants of the 0.001, 0.01 0.1 and 1.0% Mg-doped samples were 4.0, 3.3, 2.5 and 2.5 ns, respectively. These values coincided with the reported value of the decay time constant due to F+ centers [26, 27]. On the other hand, the decay curves measured in the ms range were approximated by a sum of two exponential decay functions. The derived decay time constants were 1.0 and 4.7 ms for the 0.001% Mg-doped sample, and 3.0 and 5.9 ms for the 0.01% Mg-doped sample, and 4.6 and 23.2 ms for the 0.1% Mg-doped sample, and 4.6 and 24.7 ms for the 1.0% Mg-doped sample. The first decay components were reasonably agree with the previously reported value due to Cr3+ ions [28]. We assumed that the remaining second decay constants are possibly due to F centers by the elimination method; however, the obtained values were not exactly consistent with the previously reported values [23]. A possible reason is that the measurement is not as accurate since the emission intensity is relatively low according to the observations in the spectra.
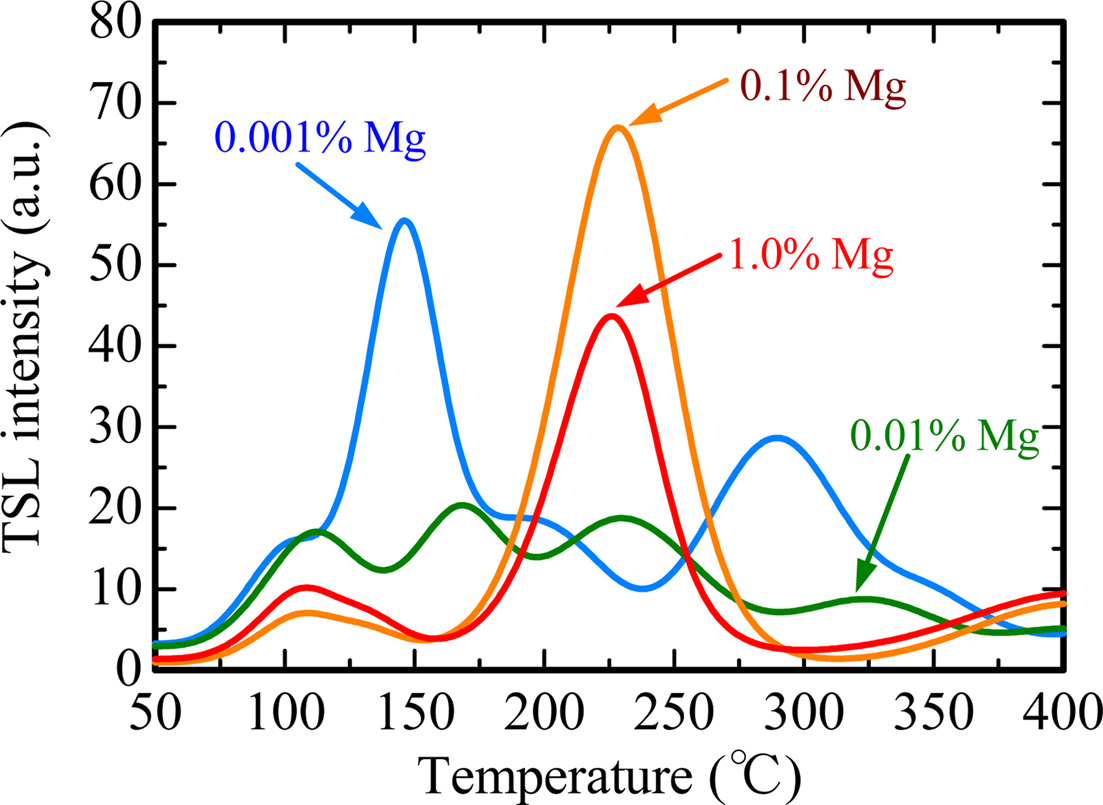
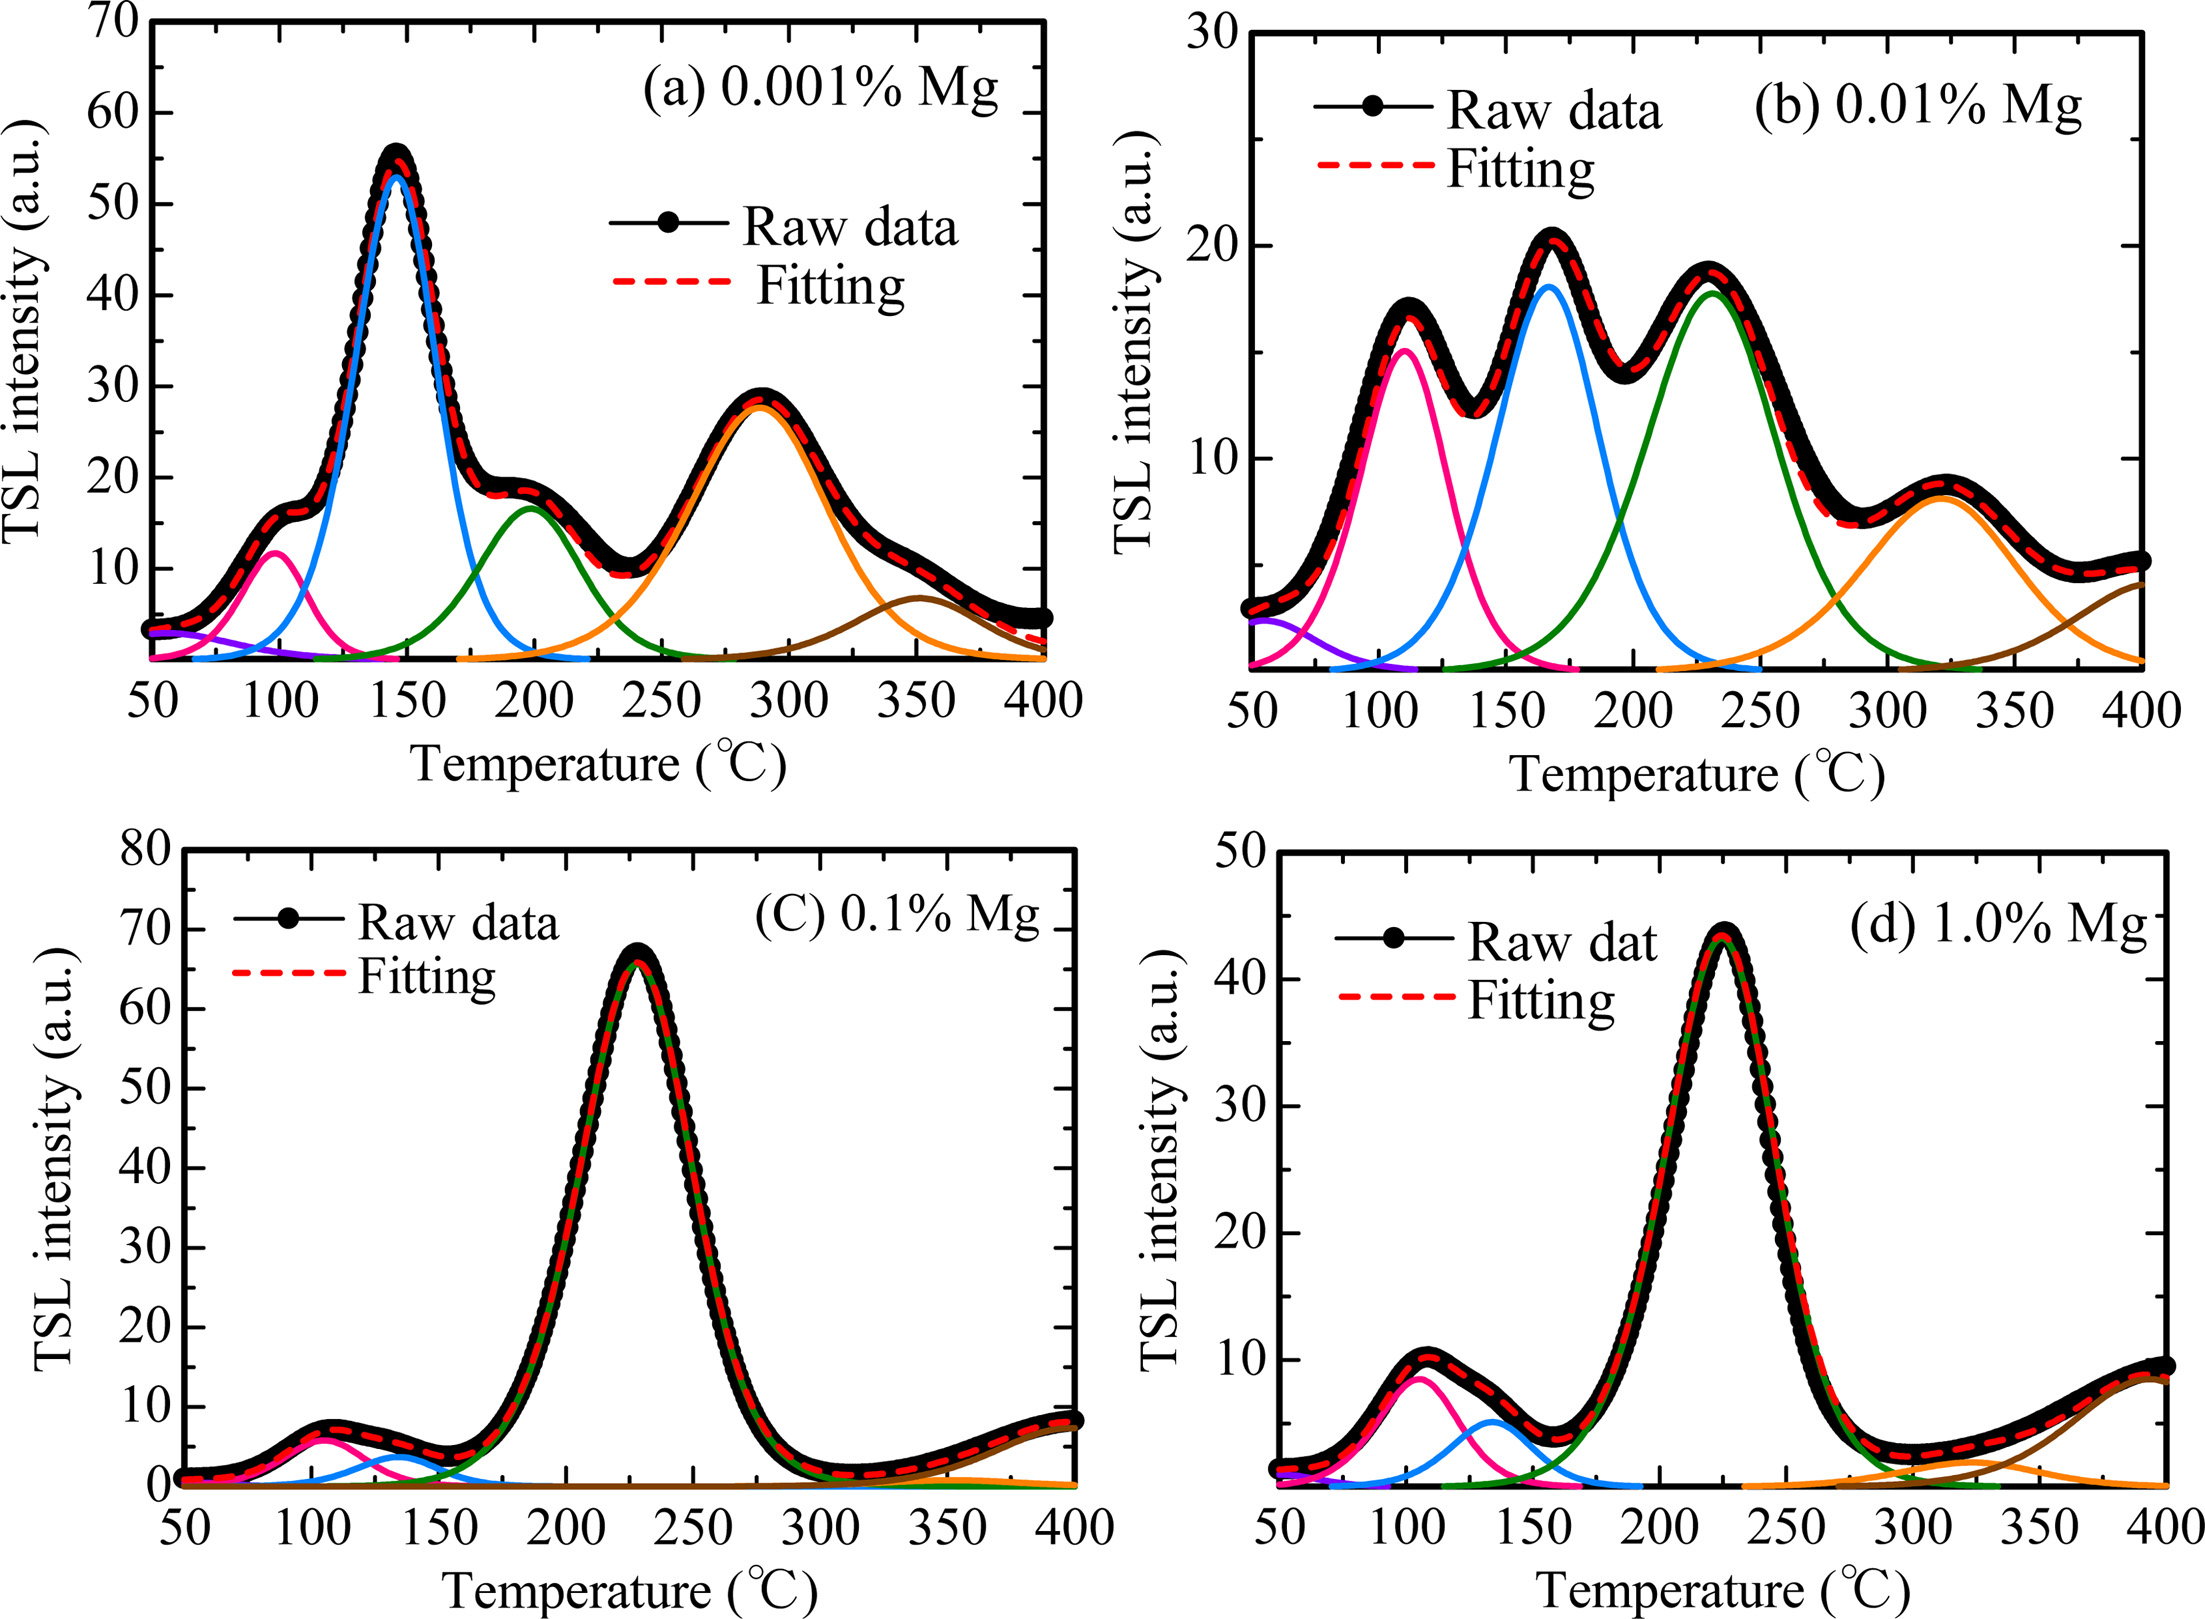
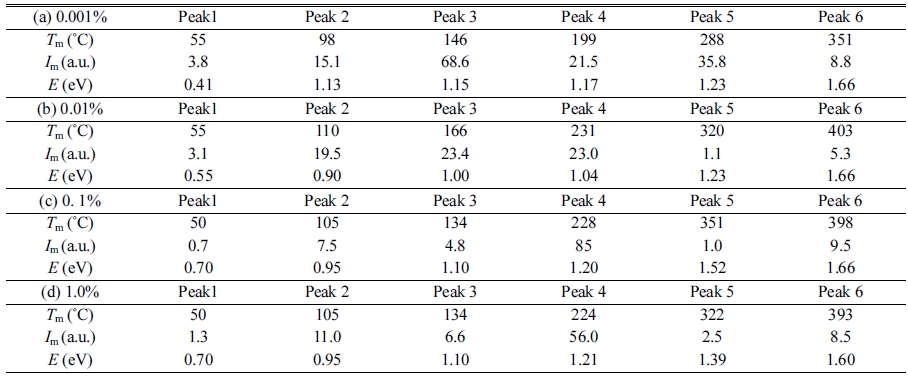
Fig. 5 represents TSL glow curves measured after the samples were irradiated with an X-ray dose of 1,000 mGy. The glow curve shapes were gradually changed with increase of the dopant amount. This result implied that Mg-doping generated additional trapping centers. In order to analyze in detail, we conducted a fitting for each TSL glow curve using by glow curve deconvolution (GCD) functions. Fig. 6 shows each TSL glow curve with GCD functions. Details of the GCD function were described in [29]. The parameters obtained by the deconvolutions were summarized in Table 1. The free parameters of the GCD functions are the maximum peak temperature (Tm), maximum peak intensity (Im) and activation energy (E). All the glow curves were best-fitted by six GCD functions. As a result of the fitting, the peaks with the highest intensity in the 0.001, 0.01, 0.1 and 1.0% Mg-doped samples are located at 146, 166, 228 and 224 ℃. It was reported that the glow peaks at approximately 105, 160 and 225 ℃ were attributed to V– center, VOH– center and V2– center, respectively [30]. Moreover, the other glow peaks were agreed with previous studies although its origins are not revealed in detail [31-33].
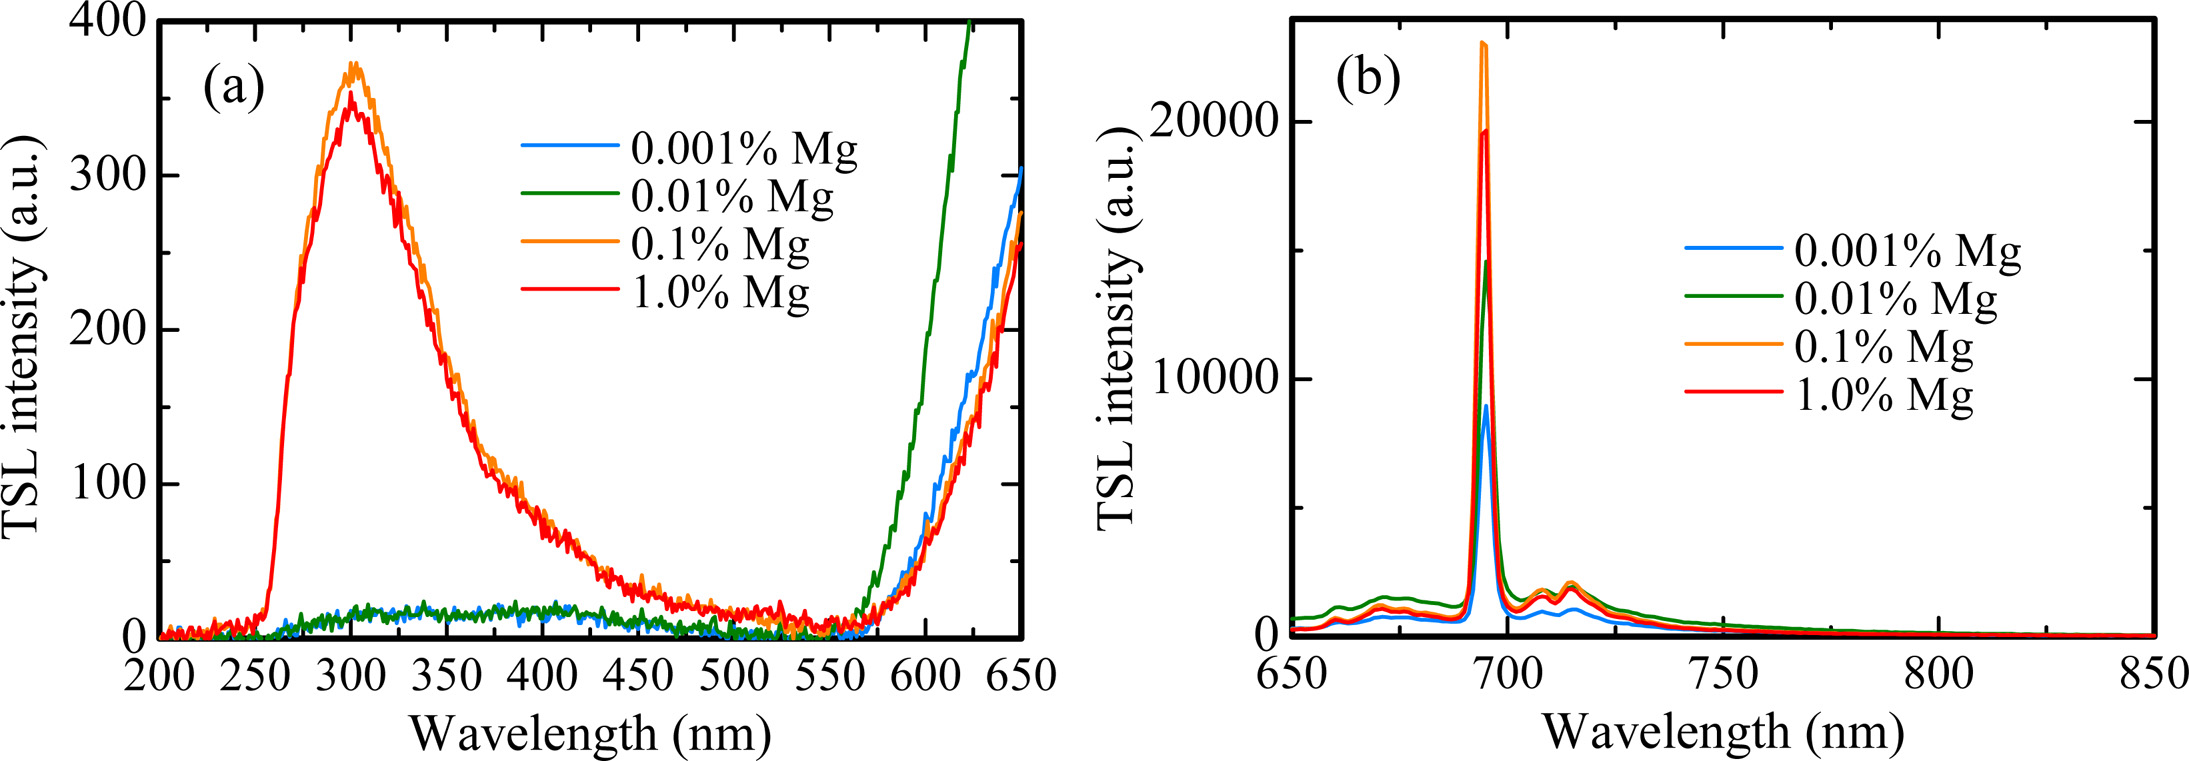
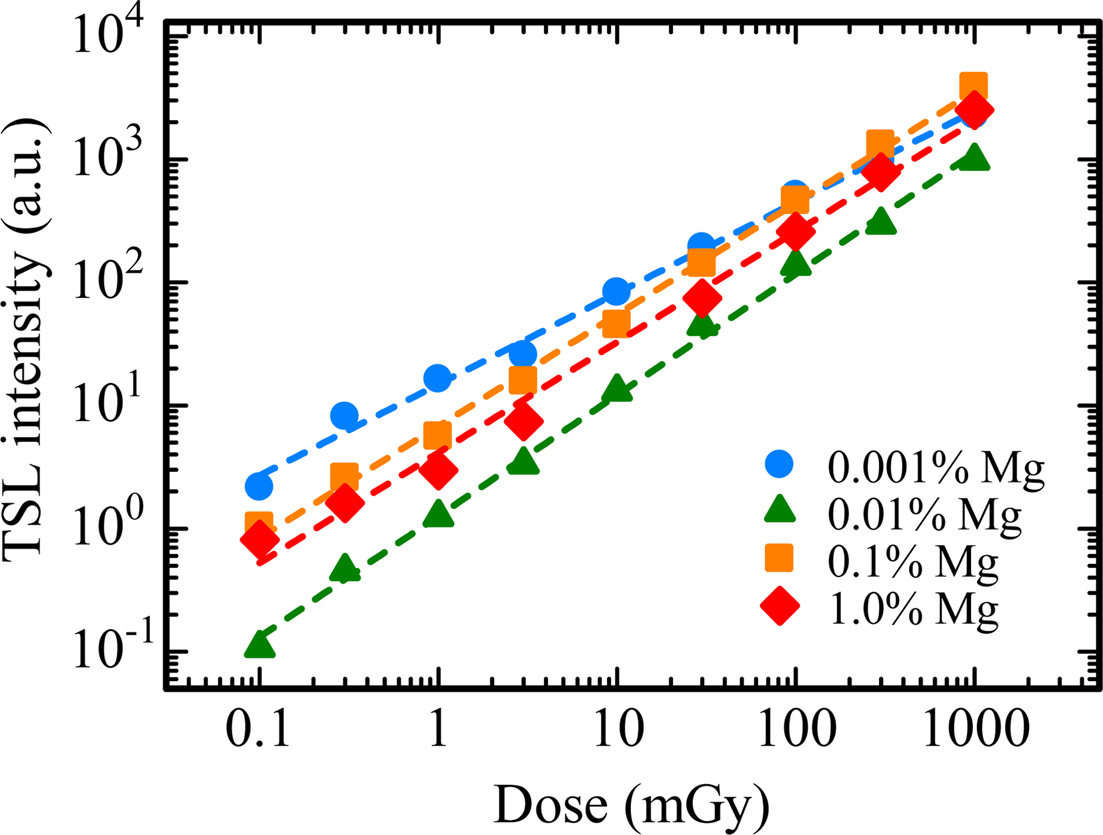
Fig. 7 indicates the TSL spectra for all the samples in the (a) UV and (b) NIR ranges. The spectra were measured at 145 ℃ for the 0.001% Mg-doped sample, 165 ℃ for the 0.01% Mg-doped sample and 230 ℃ for the 0.1 and 1.0% Mg-doped samples. As with the scintillation spectra, the emission bands were detected around 310, 380 and 693 nm. Compared with scintillation spectra, it is considered that the emission bands at 310, 380 and 693 nm are attributed to F+ centers, F centers and Cr3+ ions impurity, respectively. Fig. 8 depicts the dose response functions of all the samples. The response was defined as an integrated TSL signal for the glow peak around 145 ℃ of the 0.001% Mg-doped sample, 165 ℃ of the 0.01% Mg-doped sample and 230 ℃ of the 0.1 and 1.0% Mg-doped samples in Fig. 5. The irradiated dose range was tested from 0.1 to 1000 mGy. TSL responses were confirmed to be linear to the X-ray irradiation dose over the tested range. The linearity was confirmed by coefficient of determinations (R2) derived from a least-square fitting of the experimental data with a power function (y = axb), and R2 of 0.001, 0.01, 0.1 and 1.0% Mg-doped samples were 0.9972, 0.9987, 0.9987 and 0.9956, respectively. As a result, an optimal dopant amount as TSL dosimeter is considered to 0.1 or 1.0% in the present samples although all the samples have the same dynamic range. Since the peak positions of the highest intensity of the 0.1 and 1.0% Mg-doped samples is higher than those of the 0.001 and 0.01% Mg-doped samples, it is thought that the 0.1 and 1.0% Mg-doped samples have an advantage in terms of a fading at room temperature.
|
Fig. 1 Appearance of the synthesized Al2O3:Mg transparent ceramics under room light. |
|
Fig. 2 In-line transmittance spectra of all the samples. |
|
Fig. 3 X-ray induced scintillation spectra of all the samples in the (a) UV and (b) NIR ranges. The inset shows the scintillation spectrum of the 0.1 % Mg-doped sample with the Gaussian fitting. |
|
Fig. 4 X-ray induced scintillation decay profiles of all the Mg-doped samples in the (a) ns and (b) ms ranges. The black and orange lines show the low data and fitting curves of each sample, respectively. |
|
Fig. 5 TSL glow curves measured after the samples were irradiated with an X-ray dose of 1,000 mGy. |
|
Fig. 6 TSL glow curves with GCD functions of (a) 0.001 %, (b) 0.01 %, (c) 0.1 % and (d) 1.0 % Mg-doped samples. |
|
Fig. 7 TSL spectra for all the samples in the (a) UV and (b) NIR ranges. The spectra were measured at 145 ℃ for the 0.001 % Mg-doped sample, 165 ℃ for the 0.01 % Mg-doped sample and 230 ℃ for the 0.1 and 1.0 % Mg-doped samples. |
|
Fig. 8 Dose response curves of all the samples. The response was defined as an integrated TSL signal for the glow peak around 145 ℃ of the 0.001 % Mg-doped sample, 165 ℃ of the 0.01 % Mg-doped sample and 230 ℃ of the 0.1 and 1.0 % Mg-doped samples. |
We prepared Al2O3 transparent ceramics doped with Mg ions by the SPS technique, and then evaluated the scintillation and dosimetric properties. The experimental results of scintillation spectra and decay time constants suggested that the present samples showed emission bands at 310, 380 and 693 nm due to F+ centers, F centers and impurity Cr3+ ions, respectively. As for dosimetric properties, because the structures of TSL glow curves of each sample were changed by Mg-doping, it was implied that Mg-doping generated additional trapping centers. Each TSL glow curve consists of several peaks, in which the peak temperatures were revealed by fitting with GCD functions. Furthermore, it was demonstrated that the dynamic ranges for all the samples were over the range of 0.1 to 1,000 mGy.
This work was supported by Grant-in-Aid for Scientific Research (A) (17H01375) and (B) (18H03468) from the Ministry of Education, Culture, Sports, Science and Technology of the Japanese government (MEXT), A-STEP from Japan Science and Technology Agency (JST) and Japan Society for the Promotion of Science (JSPS) Research Fellow (17J09501). The Cooperative Research Project of Research Institute of Electronics, Shizuoka University, Terumo Foundation for Life Sciences and Arts, Izumi Science and Technology Foundation, SEI Group CSR Foundation, and The Iwatani Naoji Foundation are also acknowledged.
- 1. P. Covens, D. Berus, N. Buls, and P. Clerinx, Radiat. Prot. Dosim. 124 (2007) 250-259.
-

- 2. M. Ranogajec-Komor, Radiation Safety Management 2[1] (2002) 2-16.
-
- 3. E.R. Harrison, Am. J. Phys. 46 (1978) 948-949.
-
- 4. J.A. Harvey, N.P. Haverland, and K.J. Kearfott, Appl. Radiat. Isot. 68 (2010) 1988-2000.
-
- 5. E. Bulur, and H.Y. Göksu, Radiat. Meas. 29 (1998) 639-650.
-
- 6. Y. Miyamoto, Y. Takei, H. Nanto, T. Kurobori, A. Konnai, T. Yanagida, A. Yoshikawa, Y. Shimotsuma, M. Sakakura, K. Miura, K. Hirao, Y. Nagashima, and T. Yamamoto, Radiat. Meas. 46 (2011) 1480-1483.
-
- 7. S.W.S. McKeever, M.S. Akselrod, N.A. Larsen, and V. Whitley, J. Appl. Phys. 84 (1998) 3364-3373.
-
- 8. S.W.S. McKeever, M.S. Akselrod, L.E. Colyott, N. Agersnap Larsen, J.C. Polf, and V. Whitley (INVITED), Radiat. Prot. Dosim. 84 (1999) 163-166.
-
- 9. T. V Perevalov, A. V Shaposhnikov, V.A. Gritsenko, H. Wong, J.H. Han, and C.W. Kim, JETP Lett. 85 (2007) 165-168.
-
- 10. B.G. Markey, L.E. Colyott, and S.W.S. McKeever, Radiat. Meas. 24 (1995) 457-463.
-
- 11. M.S. Akselrod, and A.E. Akselrod, Radiat. Prot. Dosim. 119 (2006) 218-221.
-
- 12. B.N. Kim, K. Hiraga, K. Morita, and H. Yoshida, J. Eur. Ceram. Soc. 29 (2009) 323-327.
-
- 13. D. Jiang, D.M. Hulbert, U. Anselmi-Tamburini, T. Ng, D. Land, and A.K. Mukherjee, J. Am. Ceram. Soc. 91 (2008) 151-154.
-
- 14. T. Kato, G. Okada, T. Yanagida, Opt. Mater. 54 (2016) 134-138.
-
- 15. F. Nakamura, T. Kato, G. Okada, N. Kawaguchi, K. Fukuda, and T. Yanagida, Ceram. Int. 43 (2017) 7211-7215.
-
- 16. F. Nakamura, T. Kato, G. Okada, N. Kawaguchi, K. Fukuda, and T. Yanagida, J. Eur. Ceram. Soc. 37 (2017) 1707-1711.
-
- 17. G. Okada, S. Kasap, and T. Yanagida, Opt. Mater. 61 (2016) 15-20.
-
- 18. T. Kato, G. Okada, N. Kawaguchi, T. Yanagida, J. Lumin. 192 (2017) 316-320.
- 19. F. Nakamura, T. Kato, G. Okada, N. Kawaguchi, K. Fukuda, and T. Yanagida, Ceram. Int. 43 (2017) 604-609.
-
- 20. T. Yanagida, K. Kamada, Y. Fujimoto, H. Yagi, and T. Yanagitani, Opt. Mater. 35 (2013) 2480-2485.
-
- 21. T. Yanagida, Y. Fujimoto, T. Ito, K. Uchiyama, and K. Mori, Appl. Phys. Express. 7 (2014) 6-8.
-
- 22. T. Yanagida, Y. Fujimoto, N. Kawaguchi, and S. Yanagida, J. Ceram. Soc. Jpn. 121 (2013) 988-991.
-
- 23. T.Uchino, M. Itou, and A. Fujiwara, J. Phys. Chem. C 113 (2009) 20949-20957.
-
- 24. Y. Futami, T. Yanagida, and Y. Fujimoto, Jpn. J. Appl. Phys. 53 (2014) 10-13.
-
- 25. A.I. Surdo, V.A. Pustovarov, V.S. Kortov, A.S. Kishka, and E.I. Zinin, Nucl. Instrum. Methods Phys. Res., Sect. A 543 (2005) 234-238.
-
- 26. T. Kato, N. Kawano, G. Okada, N. Kawaguchi, and T. Yanagida, Nucl. Instrum. Methods Phys. Res., Sect. B (2017) 0-1.
- 27. H. Kimura, F. Nakamura, T. Kato, D. Nakauchi, N. Kawano, G. Okada, N. Kawaguchi, and T. Yanagida, Optik (Munich, Ger.) 157 (2018) 421-428.
-
- 28. E.H. Penilla, C.L. Hardin, Y. Kodera, S.A. Basun, D.R. Evans, and J.E. Garay, J. Appl. Phys. 119 (2016).
-
- 29. G. Kitis, J.M. Gomez-Ros, and J.W.N. Tuyn, J. Phys. D: Appl. Phys. 31 (1998) 2636-2641.
-
- 30. G.P. Summers, Radiat. Prot, Dosim. 8 (1984) 69-80.
- 31. A.E. Akselrod, and M.S. Akselrod, Radiat. Prot. Dosim. 100 (2002) 217-20.
-
- 32. D.R. Mishra, M.S. Kulkarni, K.P. Muthe, C. Thinaharan, M. Roy, S.K. Kulshreshtha, S. Kannan, B.C. Bhatt, S.K. Gupta, and D.N. Sharma, Radiat. Meas. 42 (2007) 170-176.
-
- 33. N. Salah, Z.H. Khan, and S.S. Habib, Nucl. Instrum. Methods Phys. Res., Sect. B 269 (2011) 401-404.
-
 This Article
-
2019; 20(5): 449-454
Published on Oct 31, 2019
- 10.36410/jcpr.2019.20.5.449
- Received on Nov 15, 2018
- Revised on Jan 29, 2019
- Accepted on May 9, 2019
Services
- Abstract
introduction
materials and methods
results and discussion
conclusions
- Acknowledgements
- References
- Full Text PDF
Shared
Correspondence to
- Takumi Kato
-
Nara Institute of Science and Technology (NAIST), 8916-5, Takayama-cho, Ikoma-shi, Nara 630-0192, Japan
Tel : +81-743-72-6144 - E-mail: kato.takumi.ki5@ms.nasit.jp
Clean-Energy Research Institute(CRI), Hanyang University, 222, Wangsimni-ro, Seongdong-gu, Seoul, 04763, Korea
E-mail: jcpr@hanyang.ac.kr