


- Structural and surface characteristics of TiO2 thin films grown by RF magnetron sputtering
Bong-Ju Leea, Youn-Saup Yoonb and Myung-Bok Leec,*
aDepartment of Physics, Chosun University, Gwangju 61452, Korea
bDivision of Electrical and Electronic Engineering, Gwangju University, Gwangju 61743, Korea
cDivision of Mechanical and Metallic Mold Engineering, Gwangju University, Gwangju 61743, Korea
Titanium dioxide (TiO2) thin films were deposited on Si(100) substrates with RF magnetron sputtering, and variations of their structural and surface characteristics with sputtering process condition were investigated. TiO2 films were grown as a polycrystalline state with mixed phase of anatase and rutile at room temperature. The grain size and surface roughness decreased with increase of O2 gas molar ratio in ambient mixed gas of Ar and O2 during film deposition. XPS results showed the chemical state and stoichiometry did not strongly depend on Ar/O2 ratio in ambient gas. The water contact angle of the film surface became larger as the grain size and surface roughness of the film decreased. It is considered that hydrophilicity of the TiO2 film depend mainly on surface morphology and roughness rather than crystalline structure and chemical state of the film.
Keywords: TiO2 films, Sputtering, Surface morphology, Chemical state, Hydrophilicity
TiO2 is one of the most actively investigated oxide thin films because of its high refractive index, high dielectric constant, and optical transmittance in the visible light and near-infrared region [1-3]. It has attracted a lot of interest for a wide range of applications, such as optical coatings [4, 5], dye-sensitized solar cells [6], photocatalysts [7], and capacitors for ultralarge-scale integrated (ULSI) devices [8]. Since the discovery of the photocatalytic decomposition of water on TiO2 [9], the photocatalytic properties and self-cleaning effect of TiO2 thin films have been studied intensively [10-12]. They can also be used as an antibacterial coating for solar cells, exterior parts of automobiles, and outer walls of buildings using the photocatalytic properties. However, systematic studies on the physical properties of TiO2 thin films with various crystal structures and surface characteristics are insufficient.
TiO2 films can be prepared by various methods, such as electron beam evaporation [13], sol-gel process [14], the ion beam technique [15], chemical vapor deposition [16], metal-organic chemical vapor deposition (MOCVD) [17], plasma-enhanced chemical vapor deposition (PECVD) [18], pulsed laser deposition [19], reactive sputtering [20], and radio frequency (RF) magnetron sputtering [21, 22]. They have different crystalline structures and wide variation of properties according to the preparation methods and process conditions. Among various fabrication methods of TiO2 thin films, RF magnetron sputtering is one of the most adequate to industrialize, because it is easy to deposit crystalline thin films at lower temperatures, easy to control the film stoichiometry, and able to obtain coatings that have high density and high thickness uniformity over a large area. Deposition and evaluation of TiO2 films by RF magnetron sputtering have been extensively carried out with variations in sputtering process parameters [23-25]. However, few experiments have been made on sputter deposition of TiO2 thin films while varying the ratio of Ar and O2 gases over a wide range. The variations of the ratio of constituent gases in gas atmosphere can change the crystalline and surface structures, which in turn can change the physical properties of TiO2 thin films in a very wide range.
In this study, TiO2 thin films were deposited by RF magnetron sputtering with variation of the partial molar ratio of Ar and O2 in the ambient gas, and their hydrophilic properties were investigated according to the crystal structure, surface morphology, and chemical state and composition.
TiO2 thin films were deposited on Si(100) substrates by RF magnetron sputtering using a TiO2 ceramic target (VTM, 99.99% purity) with a diameter of 2 inches as a source material. The substrate was ultrasonically cleaned successively in acetone, isopropyl alcohol, and deionized water each for 5 minutes, and then dried by blowing N2 gas. After the cleaning, the substrate was placed on the sample holder facing the target at a fixed distance of 50 mm in a vacuum chamber. The sputter chamber was evacuated using a turbomolecular pump aided with a rotary pump to a base pressure less than 5 ´ 10-6 Torr. After reaching the targeted degree of vacuum, Ar and/or O2 gas were/was introduced into the chamber using a mass flow controller at a flow rate of 10 sccm in total and kept at 5 mTorr as the working pressure. The degree of vacuum was measured using a Pirani gauge and penning gauge and the ambient pressure in the chamber was adjusted using a main valve. Before the deposition of the samples, the pre-sputtering was performed for 5 minutes, while the shutter being closed, to remove contamination on the target surface and to stabilize the plasma state. After the deposition of each film, the RF power was turned off and the substrate was naturally cooled down to less than 100 °C in the chamber. The film deposition was carried out with the variation of the relative ratios of Ar and O2 gas flow rate while keeping the total inflow of the reaction gas constant. Details of the sputtering conditions for the TiO2 film deposition are summarized in Table 1.
The thickness of the prepared TiO2 thin film was determined by the surface profilometer (Sloan, DEKTAK 3030). The crystal structure of the thin film was evaluated by an X-ray diffractometer (XRD, Rigaku, D/MAX 2550V) with CuKα radiation under an applied voltage of 40 kV, a current of 100 mA, and an incident angle of 1° in the range of 10-80°. The surface morphology of the film was measured by a high resolution field emission scanning electron microscope (FE-SEM, Hitachi, S-4700) and an atomic force microscope (AFM, PSI, XE-100). The chemical composition and state were characterized by an X-ray photoelectron spectrometer (XPS, ThermoFisher Scientific, K-ALPHA+). In order to evaluate the hydrophilicity of the surface of the thin film, the contact angle with water droplet was measured using a contact angle analyzer (SEO 300, Phoenix 300 Touch) in the as-deposited state.
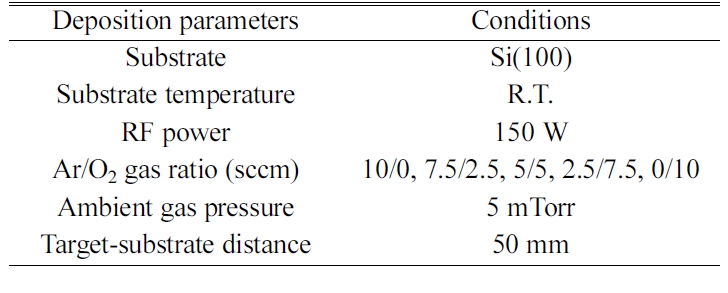
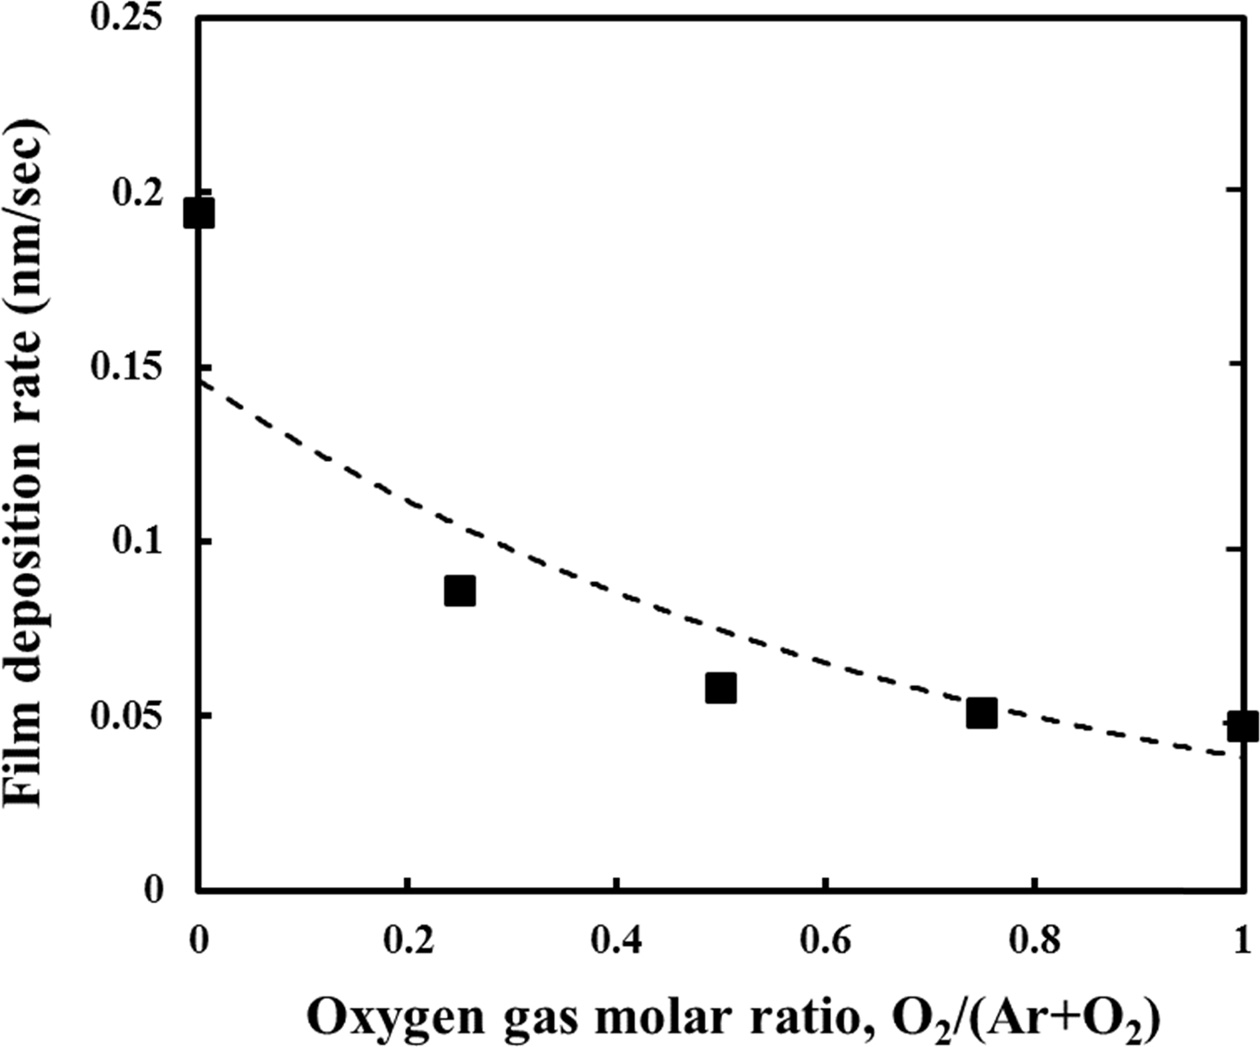
Fig. 1 shows the deposition rate of the TiO2 thin films according to the partial molar ratio of O2 gas when the flow rates of Ar and O2 are relatively changed, while the total inflow of the ractant gases to the vacuum chamber is fixed at 10 sccm. When the molar ratio of O2 is 0, that is, when the flow rates of Ar and O2 are 10 sccm and 0 sccm, respectively, the deposition rate of the TiO2 thin film is the largest, and the deposition rate of the film gradually decreases as the molar ratio of O2 increases. It is considered that the growth rate of the TiO2 film decreases with increase of O2 in the mixed reactant gas because the sputter yield of Ar is relatively larger than that of O2 due to the mass difference between Ar and O2 [26]. When an inert gas such as Ar is used as a discharge gas, most of the Ar ions diffuse back into the space after colliding with the atoms on the target surface, while there is a possibility of sticking in the case of other reactive ions such as O2.
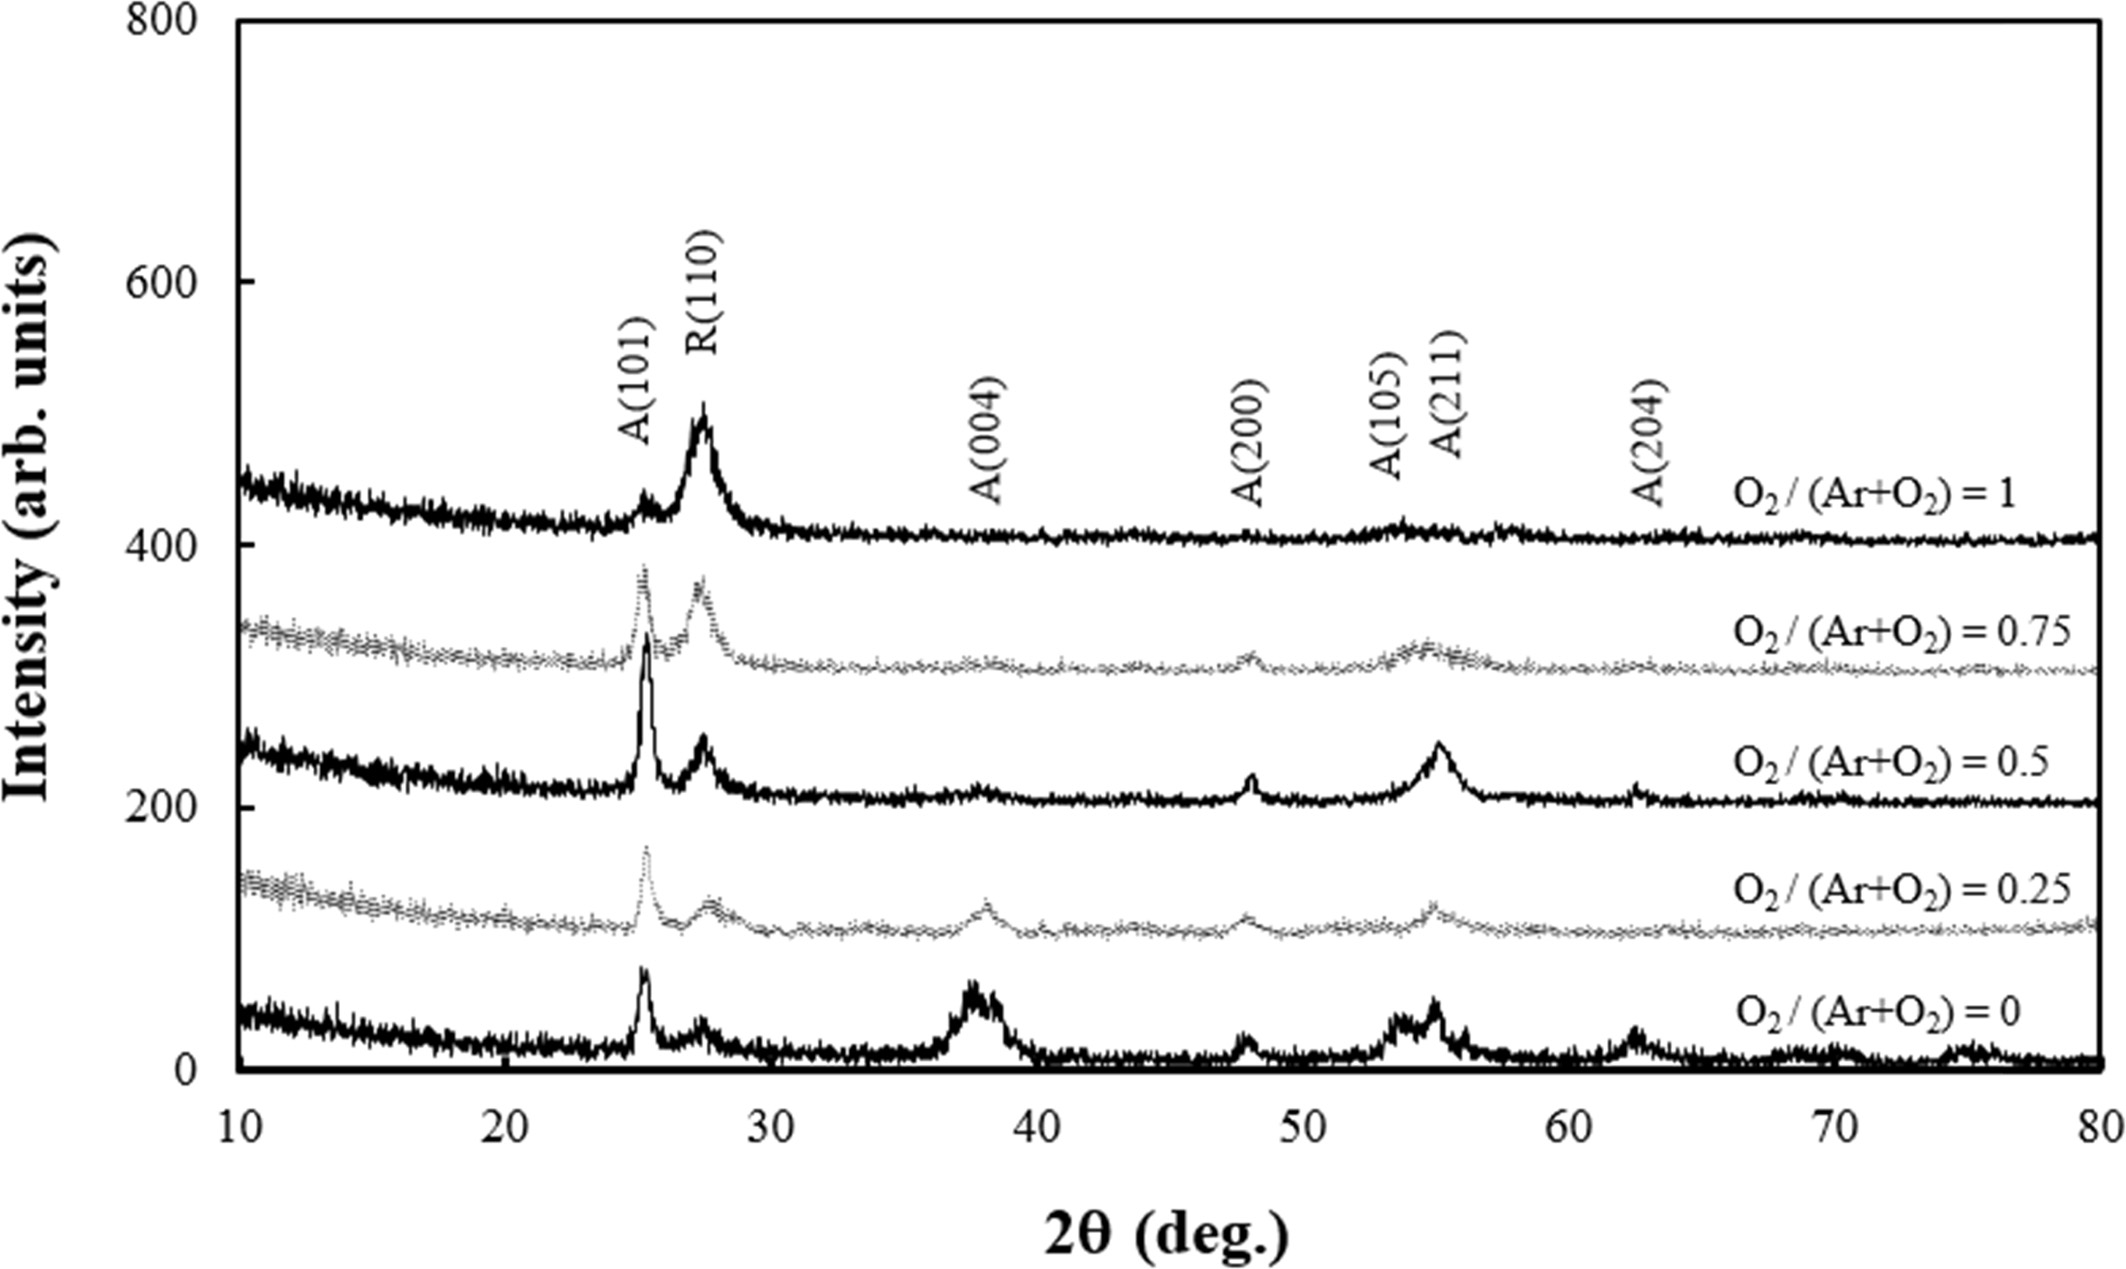
Fig. 2 shows the XRD results of the TiO2 films deposited on the Si(100) substrates at room temperature. All of the films were grown in polycrystalline structure and showed mixed state of rutile phase and anatase phase. When the gas atmosphere was Ar only, most of the crystalline structure was anatase phase. However, the portion of rutile phase, as intensity of R(110) peak represents in Fig. 2, was gradually increased as the amount of O2 in the mixed gas was increased. The relative intensities and positions of main diffraction peaks of crystalline planes of TiO2 films were consistent with those of the polycrystalline TiO2 powder. TiO2 is a wide band-gap oxide which exists in one of three crystalline polymorphs: anatase (tetragonal), rutile (tetragonal), and brookite (orthorhombic) [27]. It is reported that the anatase phase is formed at a low temperature less than 300 °C, and its photocatalytic property is the most excellent among the three phases [28]. In our results, the growth rates of TiO2 films decreased as the amount of O2 in the mixed gas increased as shown in Fig. 1. The decrease of growth rate may result in higher crystallinity of thin films because the atoms adsorbed onto the film surface have long enough time to migrate on stable lattice sites. Therefore, the rutile phase, which is known to be the most thermodynamically stable structure among the three phases [29], was gradually grown as the amount of O2 in the mixed gas was increased. It is also known that amorphous TiO2 films are obtained on unheated substrates, however, polycrystalline films were obtained in this study. The deposition of crystalline TiO2 films at room temperature is promising because it could extend the range of TiO2 film applications. It is well known that plasma atmophere during RF magnetron sputtering contains high-energy particles such as secondary electrons that bombard the film or the substrate, causing them to heat up. There is possibility that the plasma particle bombardment induced the modification of film structure to cause the crystalline film be formed on unheated substrate.
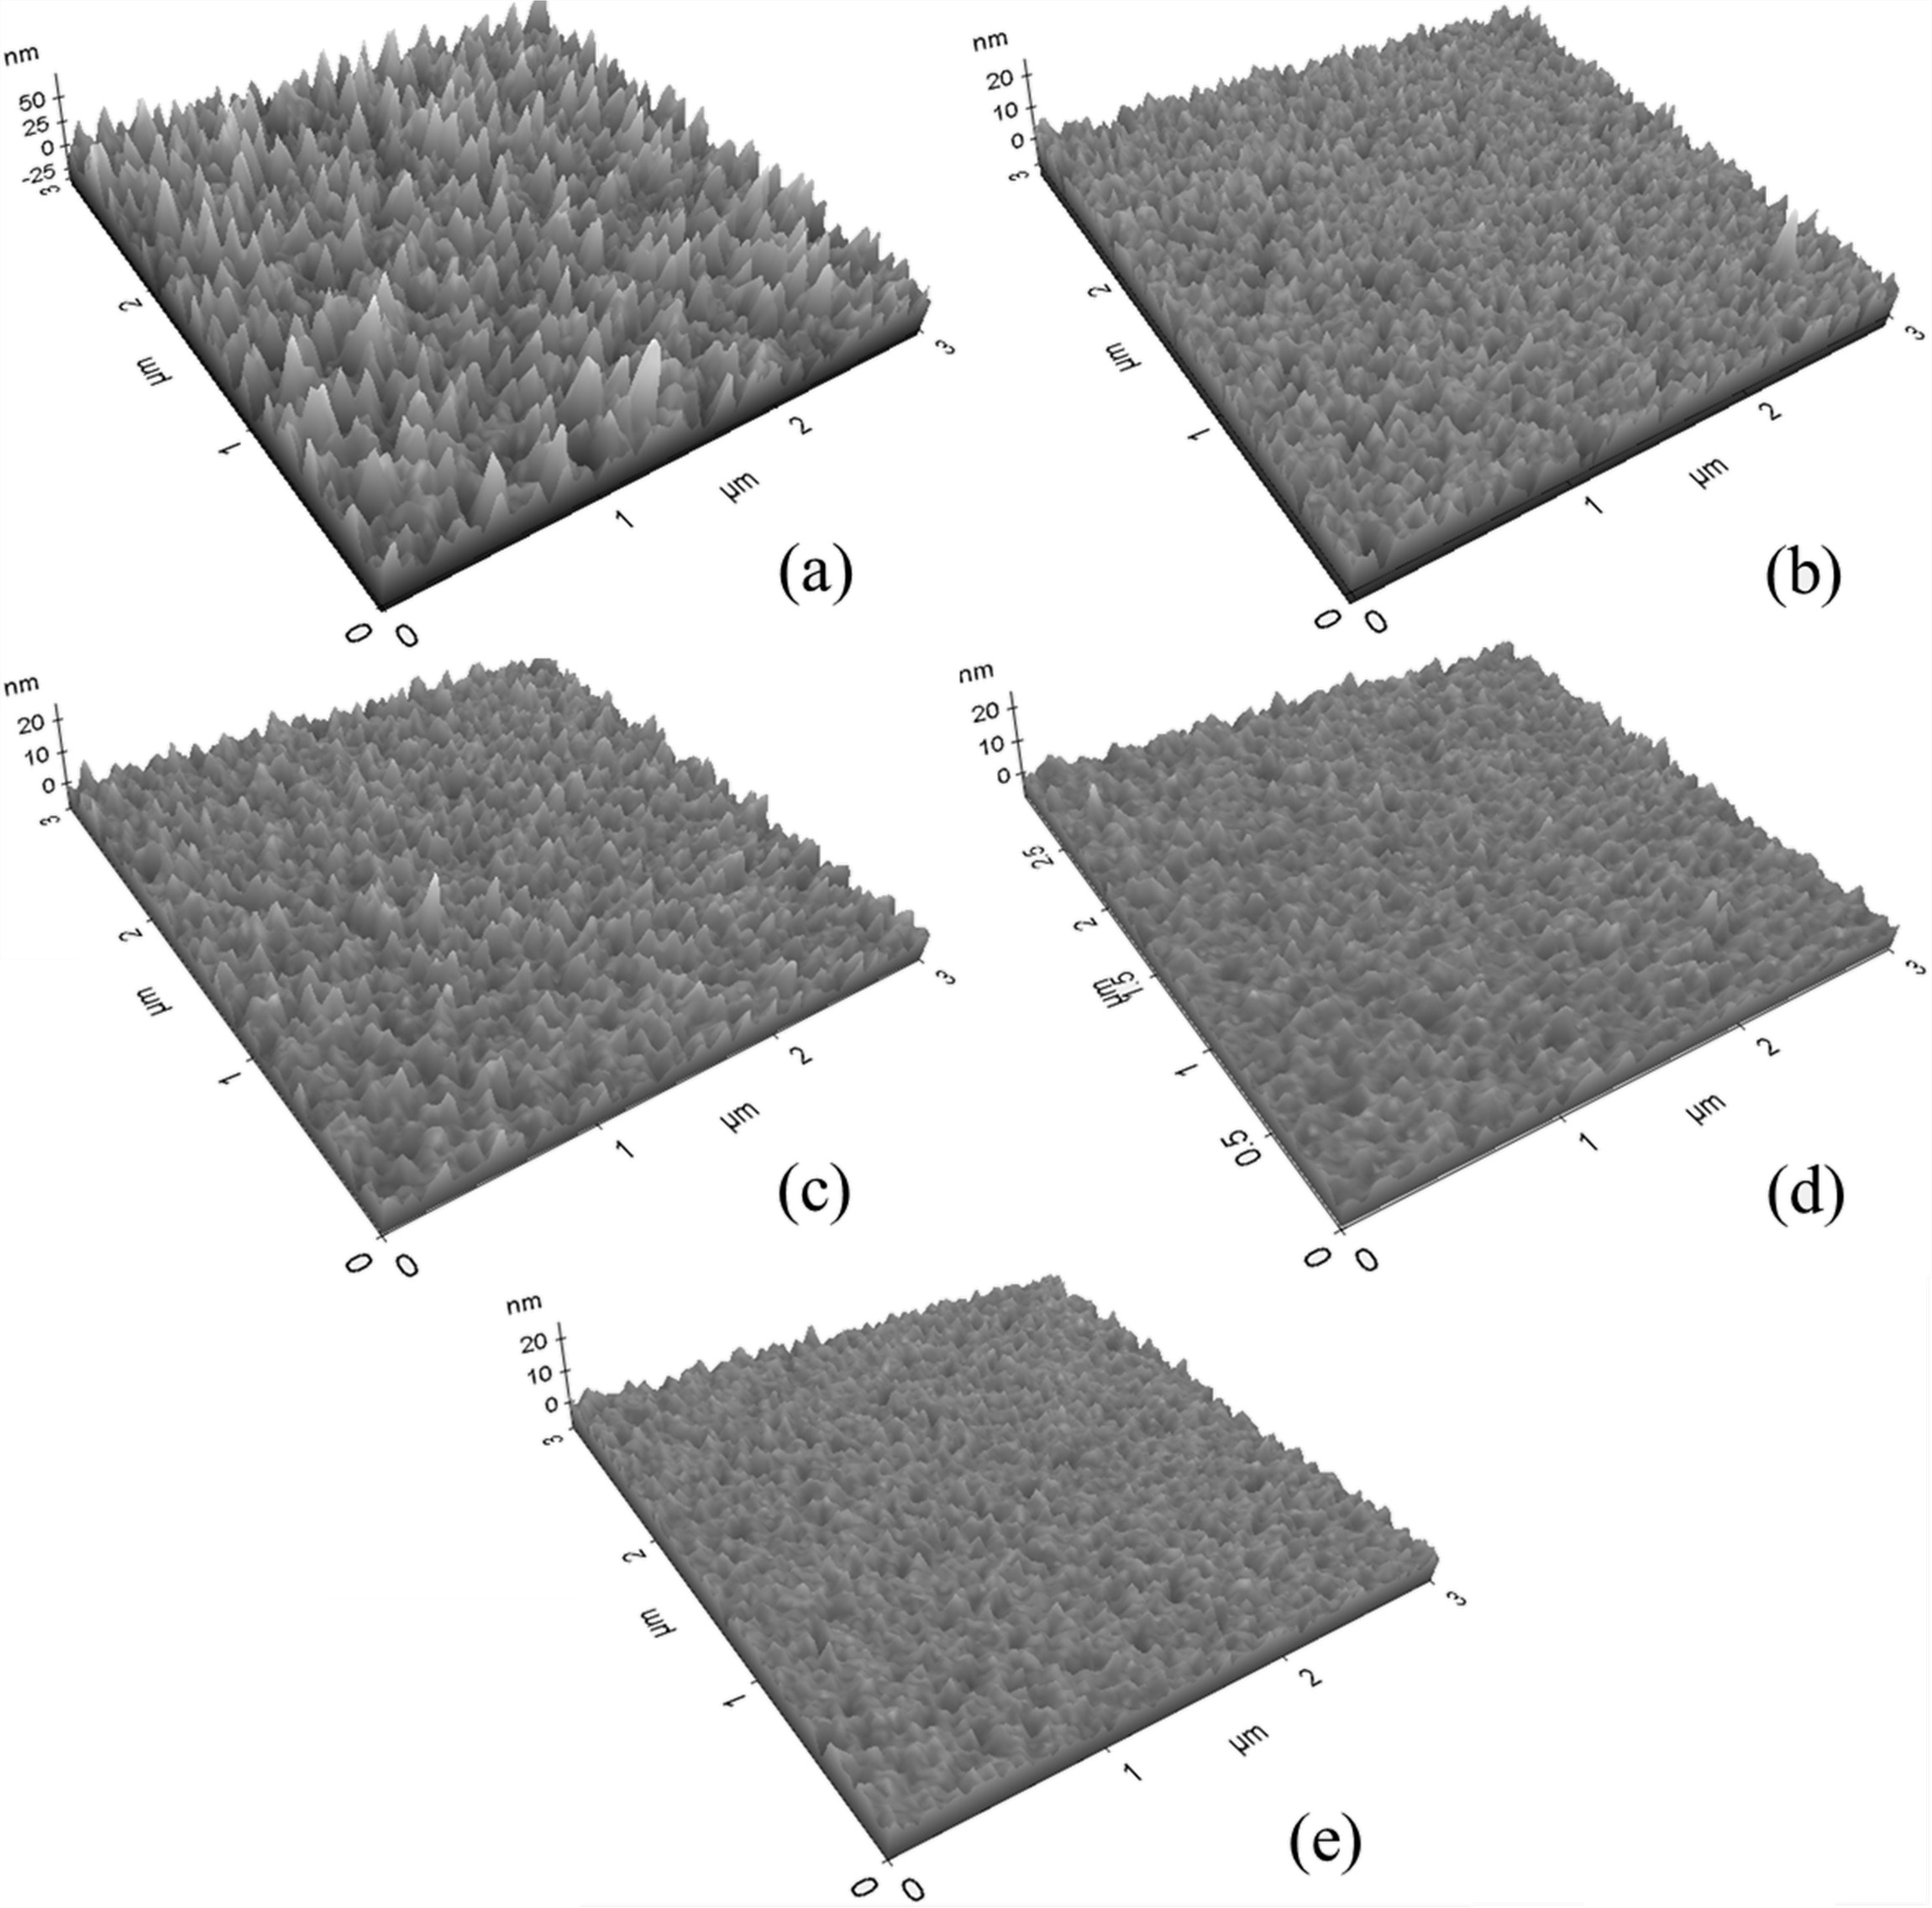
Fig. 3 shows a photograph of the surface morphology of the TiO2 thin films observed with an AFM over an area of 3 μm × 3 μm according to the molar ratio of O2 gas when the ratio of Ar and O2 in the reactant gas is relatively changed. When the molar ratio of O2 gas was 0, the surface of the TiO2 film was the roughest and the surface roughness of the TiO2 film decreased as the molar ratio of O2 was increased. The surface roughness (Ra) measured in the area of 3 μm ´ 3 μm was 10.9 nm, 2.3 nm, 2.2 nm, 1.7 nm, and 1.5 nm when the partial molar ratio of O2 gas was 0, 0.25, 0.5, 0.75, and 1.0, respectively. The grain size of the TiO2 film was the largest when the molar ratio of O2 gas was 0 and that of the TiO2 film gradually decreased as the molar ratio of O2 became larger. As a result of observation of the cross-sectional shape of the TiO2 thin films by FE-SEM, it was found that all of the films deposited by varying the molar ratio of Ar and O2 gas grew to a columnar structure.
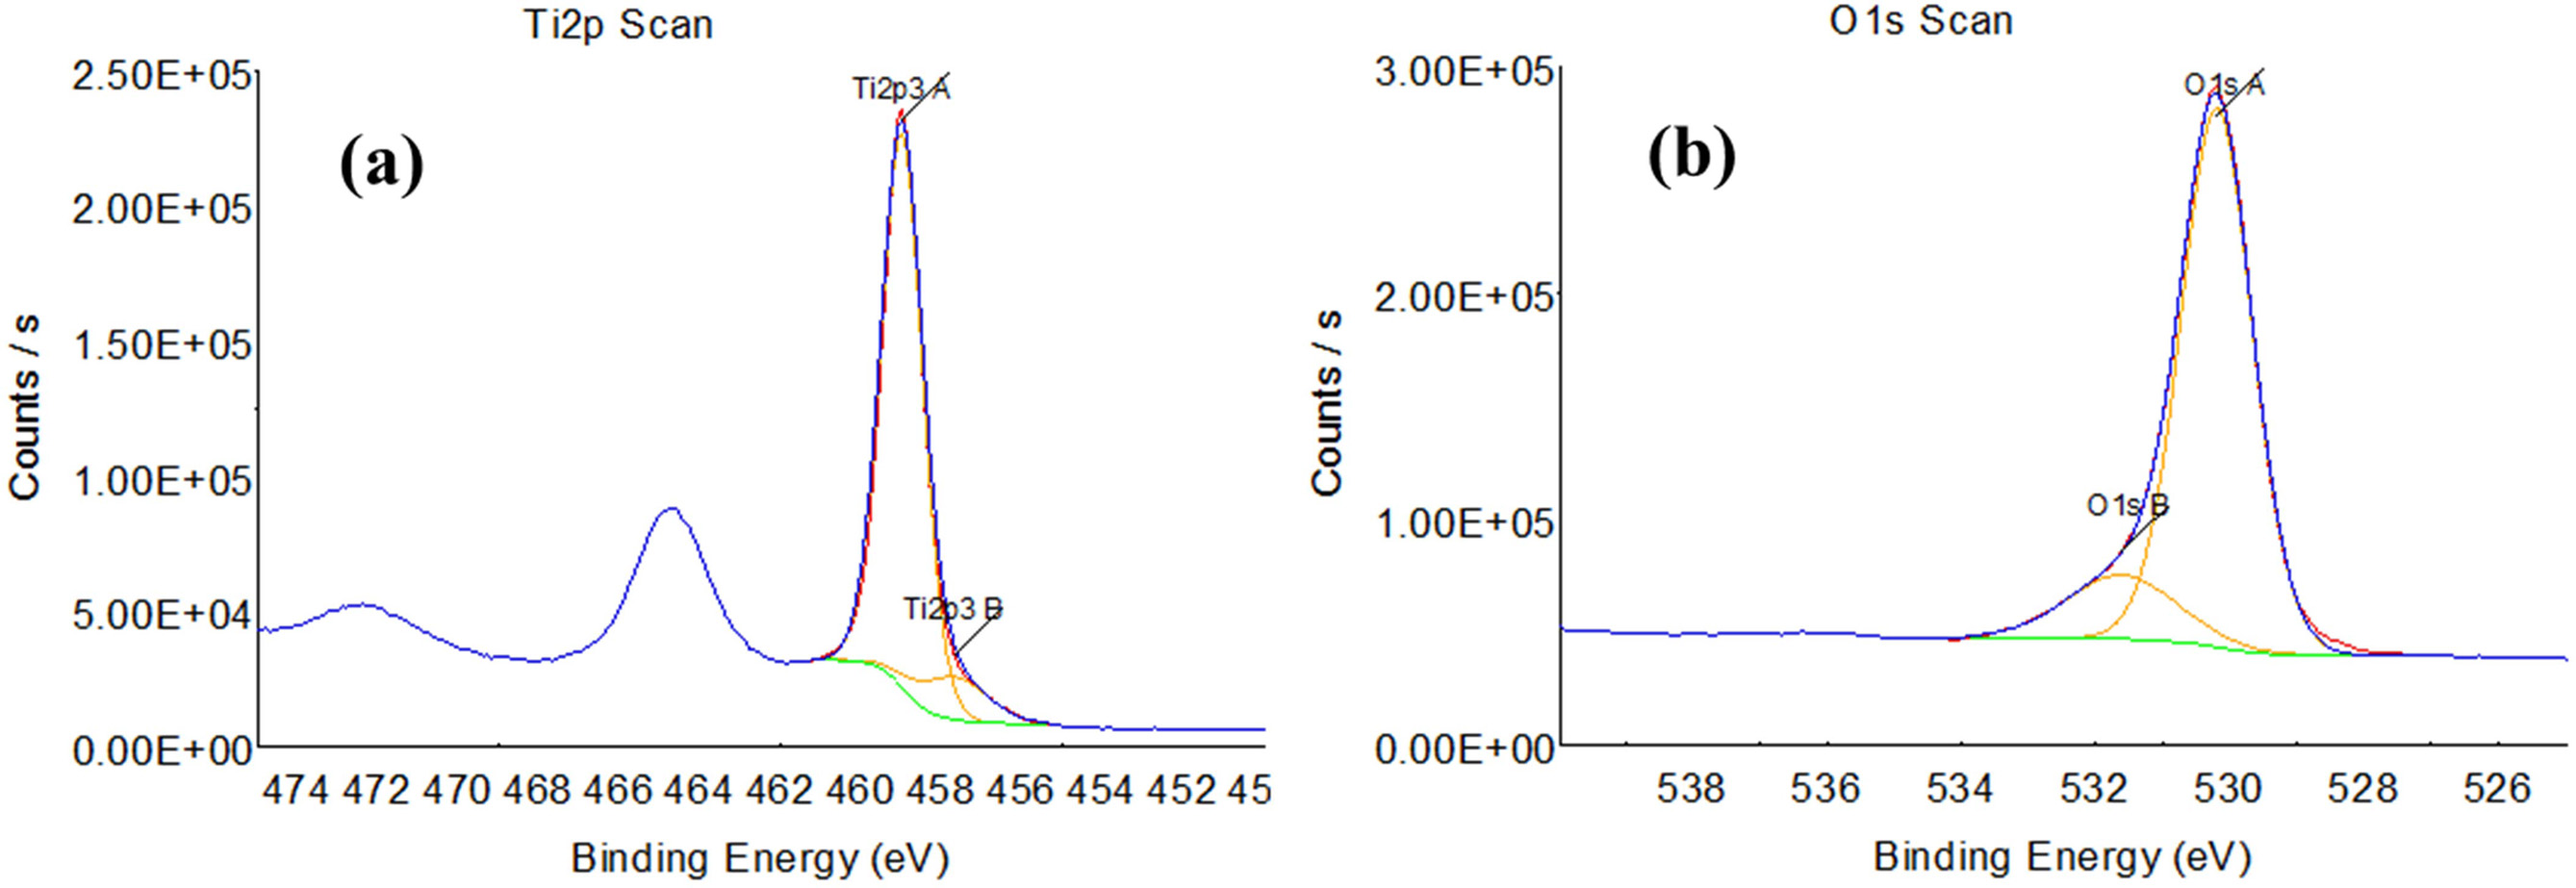
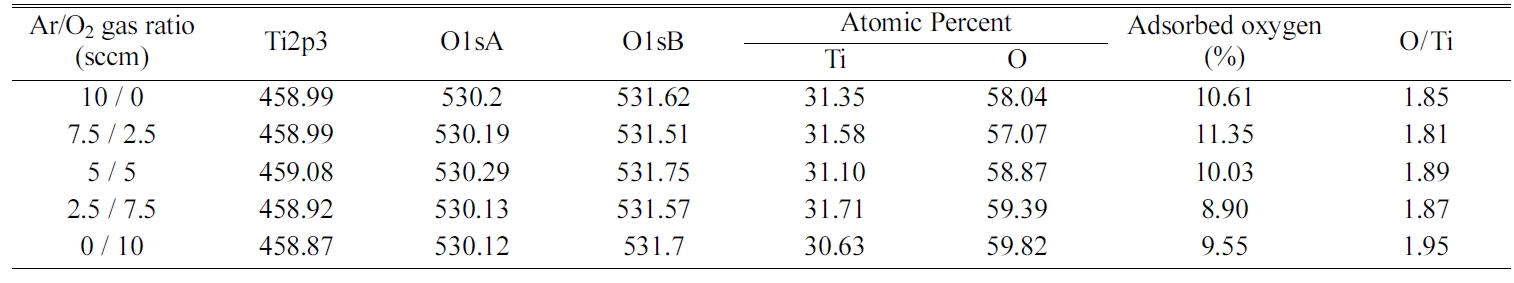
We carried out an XPS analysis to analyze the chemical state and the stoichiometry of the TiO2 thin film surface when the ratio of Ar to O2 in the mixed gas was relatively changed. In principle, the stoichiometry of thin films may affect the film structure such as crystallinity, film density, surface morphology as well as physical properties such as optical transmittance, refractive index, resistivity, etc. Figure 4 shows the Ti2p and O1s binding energy spectra according to XPS analysis of the TiO2 films deposited on a Si(100) substrate when O2 gas molar ratio was 0. All binding energy values were calibrated with that of C1s, i.e., 284.6 eV, and the sensitivity factors used for quantitative analysis were 4.415 for Ti2p3, and 2.881 for O1s. Since the contamination of the adsorbed oxygen and carbon on the as-deposited film surface reduces the Ti2p and O1s peak intensities, each sample was subjected to Ar ion etching for 1 minute and then XPS analysis was performed. Any change in peak position and chemical shift were not observed by Ar ion etching, as already has been reported in TiO2 films [30]. In Fig. 4, the two peaks at 459 eV and 464.6 eV correspond to the Ti2p3 and Ti2p1 binding energies in TiO2, repectively. The O1sA peak at a small binding energy of 530.2 eV corresponds to that of the TiO2 thin film, while the O1sB peak at large binding energy of 531.6 eV corresponds to that of oxygen adsorbed on the surface [31]. The content of Ti and O in the surface of the TiO2 film was calculated from the area surrounded by the curve fitting and the base line and summarized as shown in Table 2.
In Table 2, the values of O/Ti represent the ratios of oxygen to titanium in TiO2 films, i.e., the values of 2-x in TiO2-x. The values of O/Ti showed a stoichiometric ratio from 1.85 to 1.95 with variation of Ar/O2 ratio in the mixed gas. The XPS results indicate that the TiO2 thin film grown in the O2 only atmosphere has the closest chemical composition to the stoichiometry. The other TiO2 films, however, have a composition with a slight oxygen deficiency. With the exception of the film grown in O2 gas only, the O/Ti ratio of the TiO2 films did not show strong dependence on the O2 gas ratio in the mixed gas. It can be expected that the deposited TiO2 films assume the n-type semiconductor characteristics because of the non-stoichiometric composition lacking oxygen atom relative to titanium.
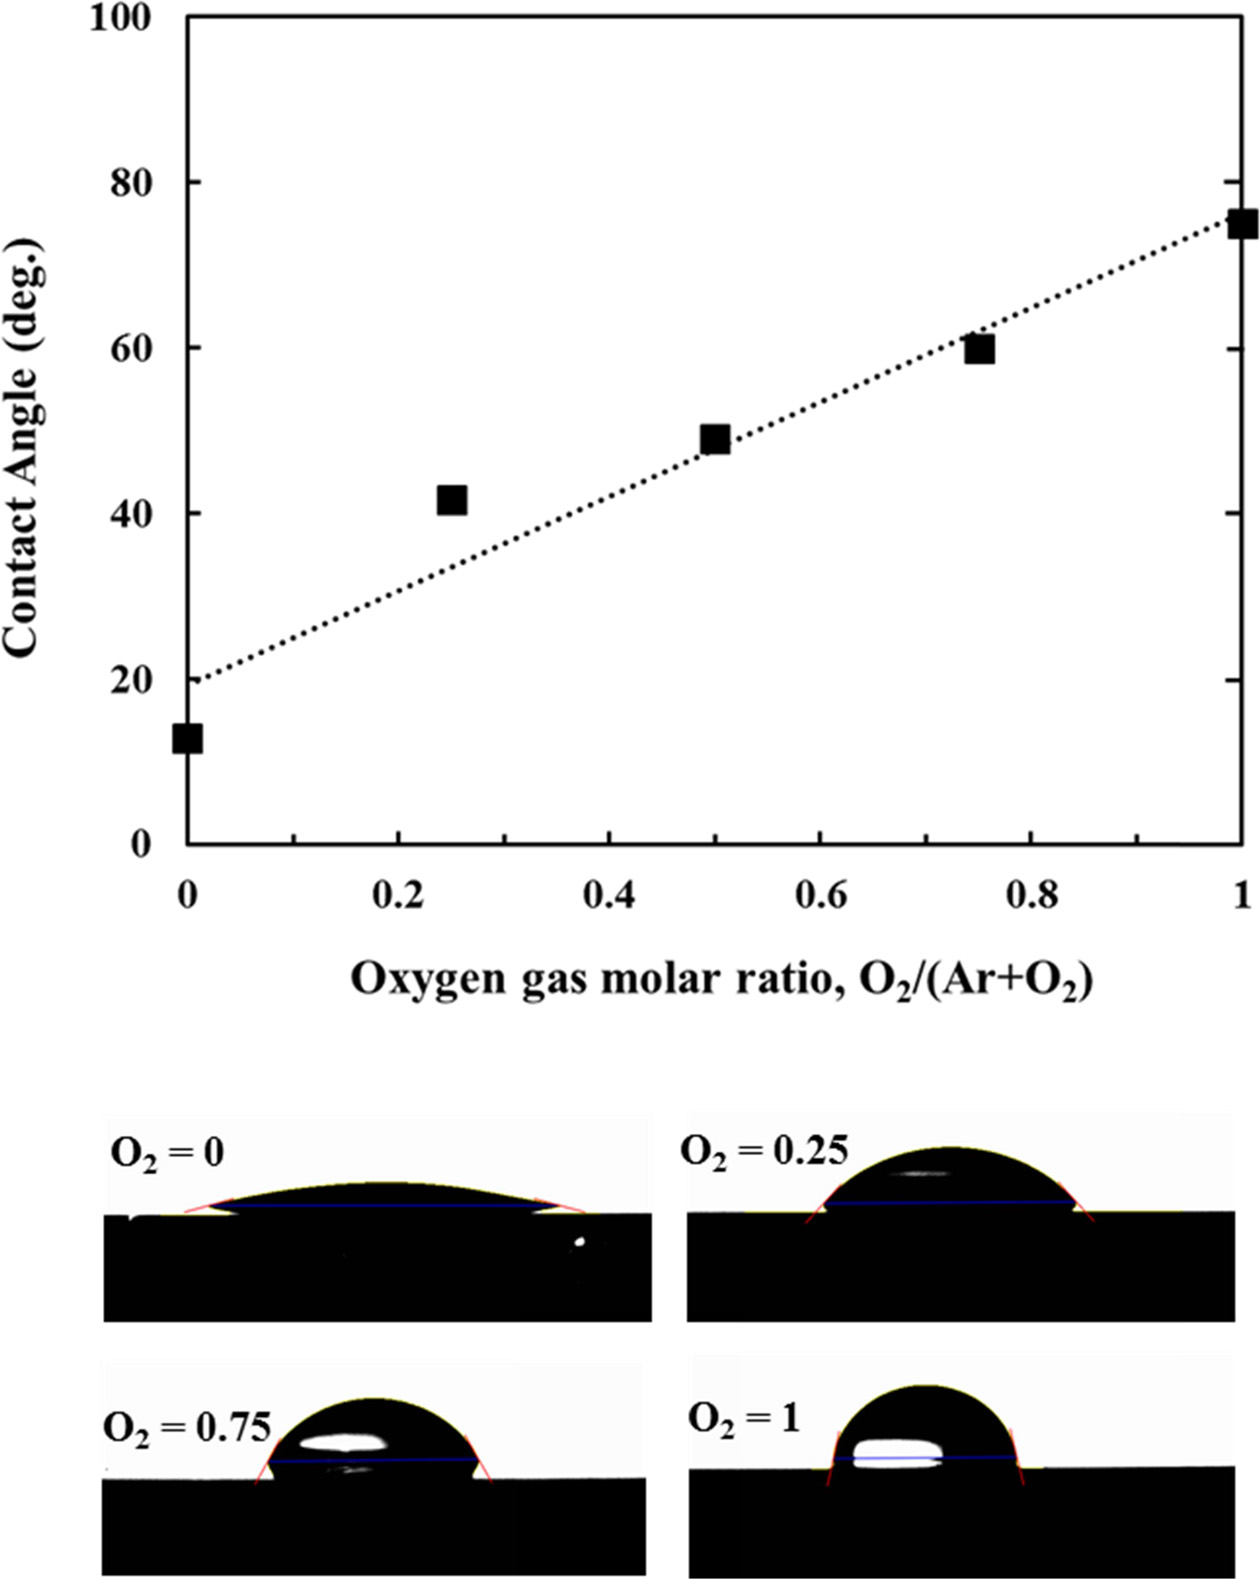
The contact angle of the TiO2 thin film with a water droplet was measured to investigate the hydrophilic properties of the TiO2 film surface according to the surface morphology and chemical state of TiO2 film surface. Fig. 5 shows the measured result of the contact angle of the TiO2 films with the water droplet according to the change of the relative ratio of Ar and O2 gas in the atmosphere mixed gas during the sputtering. The contact angle measurement was performed on the as-deposited TiO2 films on Si(100) substrate. The contact angles of the TiO2 films in the as-deposited state were less than 90o, showing a hydrophilic nature. The contact angle of the TiO2 thin film with water droplet was increased as the molar ratio of O2 gas was increased. That is, as the surface roughness and the grain size of the TiO2 thin film surface became smaller, the hydrophilicity tended to decrease. This tendency of decrease of hydrophilicity with decrease of surface roughness is consistent with that of the previous results obtained in TiO2 films [32, 33]. It is also probable that the contact angle of the TiO2 thin film increased a little with O2 partial pressure increase because the rutile phase fraction increased with O2 partial pressure, as shown in Fig. 2. On the other hand, assuming a homogeneous wetting state in which there is no air layer between the liquid droplet and the solid surface and the solid and the liquid entirely contact each other, the relationship between the surface roughness and the contact angle can be expressed by the following equation according to Wenzel's model [34].
cosθw = r·cosθ (1)
where, θw is the contact angle of the uneven surface, θ is the contact angle of the planar state, and r is the surface roughness factor. According to Wenzel's model, for the TiO2 films in the as-deposited state, which has a high surface energy, the contact angle becomes smaller as the surface roughness of the film becomes higher. In contrast, if the intrinsic water contact angle becomes larger than 90o by lowering the surface energy of the TiO2 thin film, for example, by water-repellency treatment, the contact angle will increase as the surface roughness increases. In this study, the relationship between surface roughness and contact angle in as-deposited TiO2 films is in good agreement with Wenzel's theory.
On the other hand, if we compare the contact angle measurement results of Fig. 5 with XRD results of Fig. 2, the crystal structure and the orientation of the TiO2 films seem to not largely affect the hydrophilicity of the TiO2 film surface. In addition, as shown in the XPS analysis results of Table 2, the ratio of Ar to O2 gas in the mixed gas does not strongly affect the chemical bonding state or the stoichiometric ratio of the TiO2 thin films. Therefore, it is considered that the hydrophilicity of the TiO2 thin film depend more strongly on the surface morphology such as the surface roughness and grain size than the chemical state or stoichiometry of the thin film surface.
|
Fig. 1 Deposition rate of TiO2 thin films with variation of O2 gas molar ratio in ambient gas.
|
|
Fig. 2 XRD patterns of TiO2 films deposited on Si(100) substrates at room temperature with variation of O2 gas molar ratio. A and R indicates the anatase and rutile phase, respectively.
|
|
Fig. 3 AFM images of TiO2 thin films deposited on Si(100) substrates with variation of O2 gas molar ratio. (a) O2/(Ar+O2) = 0, (b) O2/(Ar+O2) = 0.25, (c) O2/(Ar+O2) = 0.5, (d) O2/(Ar+O2) = 0.75, (e) O2/(Ar+O2) = 1.
|
|
Fig. 4 XPS spectra of a TiO2 film deposited on Si(100) substrate at room temperature, RF power of 150 W, ambient gas pressure of 5 mTorr, and O2 gas molecular ratio O2/(Ar+O2) = 0. (a) Ti2p1 and Ti2p3 spectra, (b) O1s spectra. The lower peak O1sB indicates the spectrum originating from adsorbed oxygen.
|
|
Fig. 5 Variation of water contact angle for the surfaces of TiO2 thin films deposited on Si(100) substrates according to variation of O2 gas molar ratio.
|
|
Table 2 Summary of XPS surface analysis results for TiO2 films deposited with variation of Ar/O2 gas ratio. |
TiO2 thin films were deposited on Si(100) substrates by RF magnetron sputtering with the variation of the ratio of Ar and O2 gas in the mixed gas. The effects of process conditions on the deposition rate, crystal structure, surface morphology, chemical bonding state and stoichiometry, and hydrophilicity of the film surface were investigated. TiO2 films were grown as polycrystalline films with mixed phase of anatase and rutile phase at room temperature. As the molar ratio of O2 gas in the mixed gas became higher, the ratio of rutile phase to anatase phase became higher. As the molar ratio of O2 gas in the mixed gas increased, the deposition rate of the thin film decreased and the surface roughness and grain size tended to decrease. The chemical state and the stoichiometry of the TiO2 thin film surface were not affected largely by the ratio of the mixed gas. The contact angle was increased as the molar ratio of O2 gas in the mixed gas was increased. In summary, it was found that the hydrophilicity of the TiO2 film surface was mainly influenced by the surface morphology of the thin film, such as the surface roughness and the grain size, rather than depending on the crystal structure and surface chemical state of the thin film.
This study was supported by research fund from Chosun University, 2017.
- 1. H. Kim, D. C. Gilmer, S. A. Campbell, D. L. Polla, Appl. Phys. Lett. 69 (1996) 3860-3862.
-

- 2. S. Tanemura, L. Miao, P. Jin, K. Kaneko, A. Terai, N. Nabatova-Gabain, Appl. Surf. Sci. 212-213 (2003) 654-660.
-
- 3. P. B. Nair, V. B. Justinvictor, G. P. Daniel, K. Joy, V. Ramakrishnan, P. V. Thomas, Appl. Surf. Sci. 257[24] (2011) 10869-10875.
-
- 4. C. Martinet, V. Paillard, A. Gagnaire, J. Joseph, J. Non-Crystal. Solids, 216 (1997) 77-82.
-
- 5. C. Euvananont, C. Junin, K. Inpor, P. Limthongkul, C. Thanachayanont, Ceram. Int. 34[4] (2008) 1067-1071.
-
- 6. A. Hadi, M. Alhabradi, Q. Chen, H. Liu, W. Guo, M. Curioni, R. Cernik, Z. Liu, Appl. Surf. Sci. 428 (2018) 1089-1097.
-
- 7. S. Takeda, S. Suzuki, H. Odaka, H. Hosono, Thin Solid Films, 39[2] (2001) 338-344.
-
- 8. S. K. Kim, W-D Kim, K.-M. Kim, C. S. Hwang, Appl. Phys. Lett. 85 (2004) 4112-4114.
-
- 9. A. Fujishima, K. Honda, Nature 238 (1972) 37-38.
-
- 10. J.-G. Yu, H.-G. Yu, B. Cheng, X.-J. Zhao, J. C. Yu, W.-K. Ho, J. Phys. Chem. B, 107[50] (2003) 13871-13879.
-
- 11. N. R. Mathews, E. R. Morales, M. A. Cortés-Jacome, J. A. T. Antonio, Solar Energy, 83[9] (2009) 1499-1508.
-
- 12. S. Anandan, T. N. Rao, M. Sathish, D. Rangappa, I. Honma, M. Miyauchi, ACS Appl. Mater. Interf. 5[1] (2013) 207-212.
-
- 13. S. H. Oh, D. J. Kim, S. H. Hahn, E. J. Kim, Mater. Lett. 57[26-27] (2003) 4151-4155.
-
- 14. Y-S. Song, S. Son, D. Y. Lee, M.-H. Lee, B.-Y. Kim, J. Ceram. Proc. Res., 17[11] (2016) 1197-1201.
- 15. C. Yang, H. Fan, Y. Xi, J. Chen, Z. Li, Appl. Surf. Sci. 254[9] (2008) 2685-2689.
-
- 16. G. Hyett, M. Green, I. P. Parkin, J. Am. Chem. Soc. 128[37] (2006) 12147-12155.
-
- 17. W. Wang, W. Zhao, X. Feng, L. He, Q. Cao, J. Ma, J. Alloys Compounds 708 (2017) 1195-1200.
-
- 18. W. Yang, C. A. Wolden, Thin Solid Films 515[4] (2006) 1708-1713.
-
- 19. S. Kitazawa, Y. Choi, S. Yamamoto, T. Yamaki, Thin Solid Films 515[4] (2006) 1901-1904.
-
- 20. S. Seeger, K. Ellmer, M. Weise, D. Gogova, D. Abou-Ras, R. Mientus, Thin Solid Films 605 (2016) 44-52.
-
- 21. J. Singh, S. A. Khan, J. Shah, R. K. Kotnala, S. Mohapatra, Appl. Surf. Sci. 422 (2017) 953-961.
-
- 22. S. Nezar, N. Saoula, S. Sali, M. Faiz, M. Mekki, N. A. Laoufi, N. Tabet, Appl. Surf. Sci. 395 (2017) 172-179.
-
- 23. A. R. G. Korpi, S. Rezaee, C. Luna, S. Talu, A. Arman, A. Ahmadpourian, Results in Physics, 7 (2017) 3349-3352.
-
- 24. J.-H. Park, B.-S. Kim,.B.-H. Kim, J. Kor. Crystal Growth and Crystal Technol., 21(2) (2011) 65-69.
-
- 25. C.-H. Heo, S.-B. Lee, J.-H. Boo, Thin Solid Films, 475 (2005) 183-188.
-
- 26. J.-K. Kim, S.-H. Jeong, J. Kor. Phys. Soc. 38 (2001) 19.
- 27. H. Tang, K. Prasad, R. Sanjines, P. E. Schmid, F. Levy, J. Appl. Phys. 75 (1994) 2042-2047.
-
- 28. A. Mills, S. J. Le. Hunte, Photochem. Photobiol. A: Chem. 108 (1997) 1-35.
-
- 29. D. A. H. Hanaor, C. C. Sorrell, J. Mater. Sci., 46[4] (2011) 855–874.
-
- 30. S.-H. Jung, B.-S. Kim, B.-T. Lee, H. R. Park, J.-K. Kim, J. Kor. Phys. Soc. 41[1] (2002) 67-72.
- 31. S. K. Zheng, T. M. Wang, G. Xiang, C. Wang, Vacuum 62[4] (2001) 361-366.
-
- 32. S. Song, L. Jing, S. Li, H. Fu, Y. Luan, Mater. Lett., 62[20] (2008) 3503-3505.
-
- 33. T. Watanabe, J. Ceram. Soc. Jpn., 117 (2009) 1285-1292.
-
- 34. R. N. Wenzel, Ind. Eng. Chem. 28 (1936) 988.
-
 This Article
-
2019; 20(4): 418-423
Published on Aug 31, 2019
- Received on Apr 17, 2019
- Revised on Jul 10, 2019
- Accepted on Aug 2, 2019
Services
- Abstract
introduction
experimental
results and discussion
conclusion
- Acknowledgements
- References
- Full Text PDF
Shared
Correspondence to
- Myung-Bok Lee
-
Division of Mechanical and Metallic Mold Engineering, Gwangju University, Gwangju 61743, Korea
Tel : +82-62-670-2692
Fax: +82-62-670-2698 - E-mail: mblee3@gwangju.ac.kr
Clean-Energy Research Institute(CRI), Hanyang University, 222, Wangsimni-ro, Seongdong-gu, Seoul, 04763, Korea
E-mail: jcpr@hanyang.ac.kr