


- Thermal resistance effect of graphene doped zinc oxide nanocomposite in fire retardant epoxy coatings
Tentu Nageswara Rao, Imad Hussain, Riyazuddin and Bon Heun Koo*
School of Materials Science and Engineering, Changwon National University, Changwon, Gyeongnam, Republic of Korea
Graphene doped zinc oxide nanoparticles (G-ZnO) were prepared using modified hummer’s technique together with the ultrasonic method and characterized by field emission scanning electron microscopy (FESEM), X-ray powder diffraction (XRD), fourier-transform infrared spectroscopy (FTIR) and high-resolution transmission electron microscopy (HRTEM). Different samples of epoxy resin nanocomposites reinforced with G-ZnO nanoparticles were prepared and were marked as F1 (without adding nanoparticles), F2 (1% w/w G-ZnO), and F3 (2% w/w G-ZnO) in combination of ≈ 56:18:18:8w/w% with epoxy resin/hardener, ammonium polyphosphate, boric acid, and Chitosan. The peak heat release rate (PHRR) of the epoxy nanocomposites was observed to decrease dramatically with the increasing G-ZnO nanoparticles. However, the LOI values increased significantly with the increase in wt % of G-ZnO nanoparticles. From the UL-94V data, it was confirmed that the F2 and F3 samples passed the flame test and were rated as V-0. The results obtained in the present work clearly revealed that the synthesized samples can be used as efficient materials in fire-retardant coating technology.
Keywords: G-ZnO nanoparticles, FESEM, XRD, TGA, Epoxy Nanocomposite
Flame retardants are chemical substances which are added to polymers with the expectation of enhancing the fire resistance and are immensely used in textiles, plastics, electronic hardware, and different substances to avoid fire risks [1-3]. Among various kinds of fire, retardants are organic phosphate esters with or without halogens, inorganic chemicals (for example, antimony oxides, Zinc Oxides, titanium oxides), and chlorinated and brominated organic compounds. Recently, transparent fire-resistant coatings have attracted considerable attention in some exceptional, for example, historic buildings, special furniture, heritage conservations, and cultural relics due to their good decorative and fire safety properties [4-7]. Conventional added substance fire-retardant coatings, transparent coatings are generally prepared by mixing reactive flame retardants with a matrix resin rather than by using including an additive flame retardant without delay into a matrix resin with an excessive awareness, for this reason endowing the coatings with immoderate transparency [8].
Nanotechnology applications in coatings have shown exceptional growth in recent years. This is often a result of two impartment factors: 1) elevated availability of nano-scale substances which includes various kinds of nanoparticles, and 2) advancements in processes that may control coating structure at the nanoscale. Additional important reason for this growth is the potential of nanotechnology to address many performance challenges presented by the vast range of products and structures that coatings are an integral part of. Applications of coatings embody interior and exterior house paints, interior furnishings, glass and façade coatings for high-rise buildings, every kind of transportation vehicles and structures (automobiles, airplanes, bridges, road markings, marine vessels, house crafts, etc.) and a wide assortment of industrial and non-industrial maintenance coatings [9-11]. At a much smaller scale, coatings are utilized in several electronic products and biomedical things [12]. The combination of nanoparticles into epoxy resins offers a solution to enhancing the integrity and durability of coatings because the fine particles spread in coatings can fill cavities, decrease the porousness and cause crack bridging, crack deflection and crack prostration [13-19]. Nanoparticles can also prevent epoxy disaggregation during curative, subsequent in a more homogenous coating [20-22]. Nanoparticles tend to occupy small hole defects formed as a result of local shrinkage during curing of the epoxy resin that act as a bridge interconnecting molecules [23]. This results in a reduced total free volume as well as an increase in the cross-linking density [24].
The present study was to develop non-toxic nanocomposite fire retardant coating formulations and study the thermal resistance during the degradation of the coating.
For this study Epoxy resin (Bisphenol) and amine hardener was procured from Sikadur-52 Company, USA. Graphite powder, zinc acetate, sodium nitrate, hydrogen peroxide, potassium permanganate, sodium hydroxide, potassium hydroxide, ethylene glycol and hydrazine monohydrate solution, flame retardant additive boric acid, acid source Ammonium polyphosphate, charring agent chitosan were purchased from Sigma Aldrich. Absolute ethyl alcohol bought from the Merck USA Limited. Distilled water was purified by using the Milli-Q apparatus.
Synthesis of graphene oxide
Graphene oxide was synthesized from graphite employing modified Hummer’s method. 23 mL of concentrated H2SO4 was added into a mixture of graphite 1 gram of powder and 0.5 gram of sodium nitrate. The mixture was kept in an ice bath and then 3.0 gram of potassium permanganate was added into the mixture at 15 ℃. Then the temperature was increased to 35 ℃ and the mixture was magnetically stirred for 30 min by the addition of (46 mL) distilled water slowly, during oxidation process the color was changed from dark purplish-green to dark brown after that the solution was cooled using a water bath for 10 min to stop the oxidation process and additionally 140 mL distilled water was added then the color of mixture was changed to bright yellow indicating a high oxidation level of graphite. The solution was filtered and washed several times with distilled water which resulted in thickening of the graphene oxide solution. The washing process was carried out using simple decantation of the supernatant with centrifugation technique at 6000 rpm for 30 minutes which results in the formation of graphene oxide (GO).
Synthesis of graphene based ZnO nanocomposite
The G-ZnO nanocomposite synthesized by 0.5 wt % loading of graphene was dispersed in 100 mL ethyl alcohol to get a dark brown color solution via stirring for 30 min, then 0.05 mL of hydrazine monohydrate solution was added for reduction. 0.2 M zinc acetate dihydrate was added into the above-resulted solution and then transferred into 500 mL vessel and placed in an ultrasonic bath for 2 hours sonication. The mixture was stirred for 3 hours at 80 ℃. Finally, the solution was filtered and washed 3 times with deionized water and dried at 90 ℃ for five hours to evaporate the solvents. The subsequent powder was calcinated at 450 ℃ for four hours in a muffle furnace, attained the room temperature and ground with festal mortar finally, fine nanoparticles were obtained.
Characterization
The room temperature XRD profile of the synthesized G-ZnO nanoparticles was obtained to the crystal structure and phase purity of the sample The crystalline size was calculated from the XRD spectrum using “Debye Scherrer” equation. The characterization of G-ZnO nanoparticles by FESEM (TESCAN, CZ/MIRA I LMH) showed the development of ZnO on graphene matrix. The size of the particle was observed to be 4-5 nm by HRTEM (FEI, TECNAI G2 TF20-ST). The FTIR (JASCO, FT/IR-6300) was performed at Changwon National University, and the results showed the absorption peak at 1581 cm-1 and 450 cm-1 indicated the skeletal vibration of graphene sheets and stretching vibration of Zn-O. Raman spectroscopy (JASCO, JP/NRS-3300) of ZnO-graphene composites showed the D and G bands at about 1352 and 1579 cm-1, respectively. The peak position of the G band and position of the 2D band are known as the key parameters for determination of the layer numbers of graphene sheets.
Preparation of epoxy nanocomposite coatings using G-ZnO nanoparticles
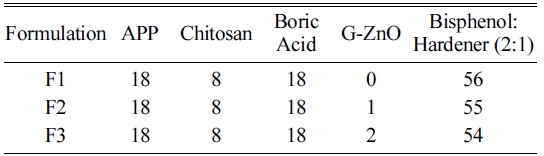
First of all, nano-G-ZnO was sonicated for 2 hours for proper dispersion. NCFRC preparation comprised three steps: grinding, mixing and curing. Initially, APP, boric acid, chitosan and nano-G-ZnO were ground for 5 min to form a homogenous mix followed by 10 min and curing agent epoxy resin was added to the composite and mixed for another 20 min for complete homogenization of formulations. The exact formulation ratio was shown in Table 1. After homogenization of the formulation epoxy nanocomposite coatings were dried at room temperature for 4 days to convert as solid. The solid samples were used for thermal analysis.
Flammability tests of the composites
The burning rate test, limiting oxygen index (LOI), UL-94 vertical burning and mass loss Wrong sentence tests were investigated flame retardancy properties of the composites. The test procedure was mentioned below.
Burning rate test
The Determination of burning rate test of composites was determined by following test guideline OPPTS 830.6315 and EEC A.10. The composite was arranged in the form of powder train approximately 250 mm long by 20 mm wide by 10 mm height on an aluminum mold which was non-combustible, non- porous and low heat conducting. A hot flame from a burner at a minimum diameter of 5 mm was applied to one end of the powder train until the powder ignites for about 2 minutes. It was found that substance does not ignite and propagate combustion either by burning with flame along 200 mm of the powder train within the 4 minutes test period, then the composite was not be considered as highly flammable.
Limiting Oxygen Index (LOI)
LOI test was conducted in accordance with ASTM D2863 guideline to evaluate the minimum amount of oxygen required to burn the sample. The LOI percentage of TPS composites was measured using oxygen index instrument (FESTEC International Co. Ltd., Korea) with composite sample size 100 mm long, 7 mm wide and 3 mm thickness at ambient condition.
UL-94 test
The test was conducted according to the ASTM D 3801standard procedure. Before performing this study, dip coated specimens were Pre-treatment at 23±1 ℃/ 50±5% relative humidity for 2 days then, at 70 ℃ for 7 days using hot air oven and then cooled in a desiccator for a minimum of 4 hours. The sample specimens of dimensions (125 mm long, 13 mm wide and 3.1 mm thickness) were reinforced in a vertical position and a flame is applied to the bottom of the sample specimen. The flame was obtained by adjusting the gas supply and flame height was adjusted20 mm yellow-tipped blue flame is produced. Increased the air supply the yellow tip disappeared and again measured the height of the flame, the flame height was adjusted accurately 20 mm. The flame was applied for ten seconds and then removed until flaming stops at which time the flame is reapplied for one more 10 seconds and then removed. Finally, the burning time and rate of composites were calculated by the vertical burning test was followed by UL-94 standards in an air atmosphere.
Cone calorimetry analysis
The combustion behavior like heat release rate (HRR) and Total heat release rate (TRR) was determined by cone calorimeter instrument (Make Fire Testing Technology, United Kingdom, and Modal 11311). The test was performed in accordance with ISO 5660 standard guidelines. For this study, the composite sample a dimension of 100 mm long by 100 mm wide by 3 mm thickness was wrapped in aluminum foil and exposed horizontally to an external heat flux of 100 KW/ m2.
Thermal stability analysis
Thermal stability of the samples was performed by TGA, Perkin Elmer Pyris-1(USA) at 10 ℃/min with a linear heating rate under inert nitrogen at a flow rate of 20 mL/min. In this case, the sample was weighed about 10 mg and the temperature increased from room temperature to 800 ℃.
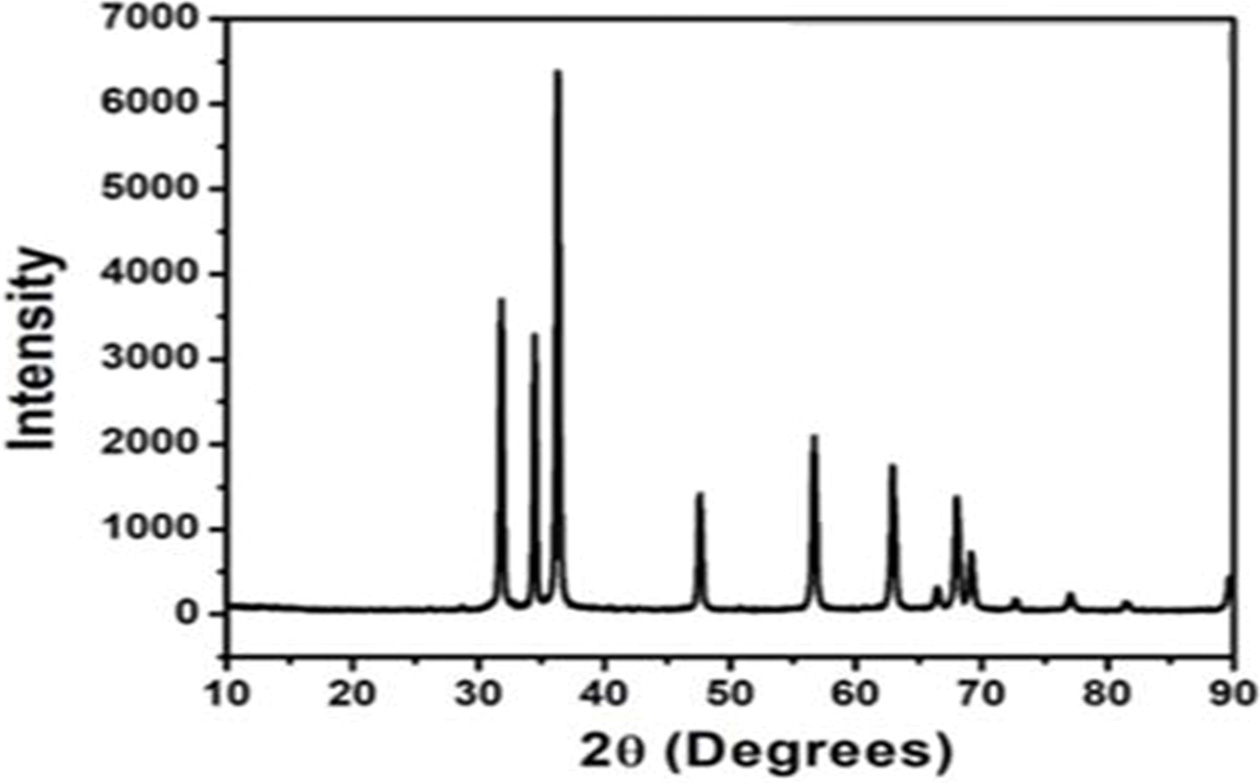
XRD pattern of G-ZnO composite
XRD pattern of G-ZnO composite is shown in Fig. 1. The major peak of graphine is seen at 2θ = 25.5° with an interlayer distance of 3.4 Å. After oxidation, the peak was observed at 2θ = 10° in GO showing the perfect oxidation and the interlayer distance of graphene is 8.8 Å. The increased interlayer distance is due to the intercalation of oxygen functional groups during the oxidation process. There are five major peaks in G-ZnO composite at 2θ value 31.8°, 34.4°, 36.2°, 47.5°, and 56.5° which correspond to (100), (002), (101), (102) and (110) crystalline plane of ZnO respectively.
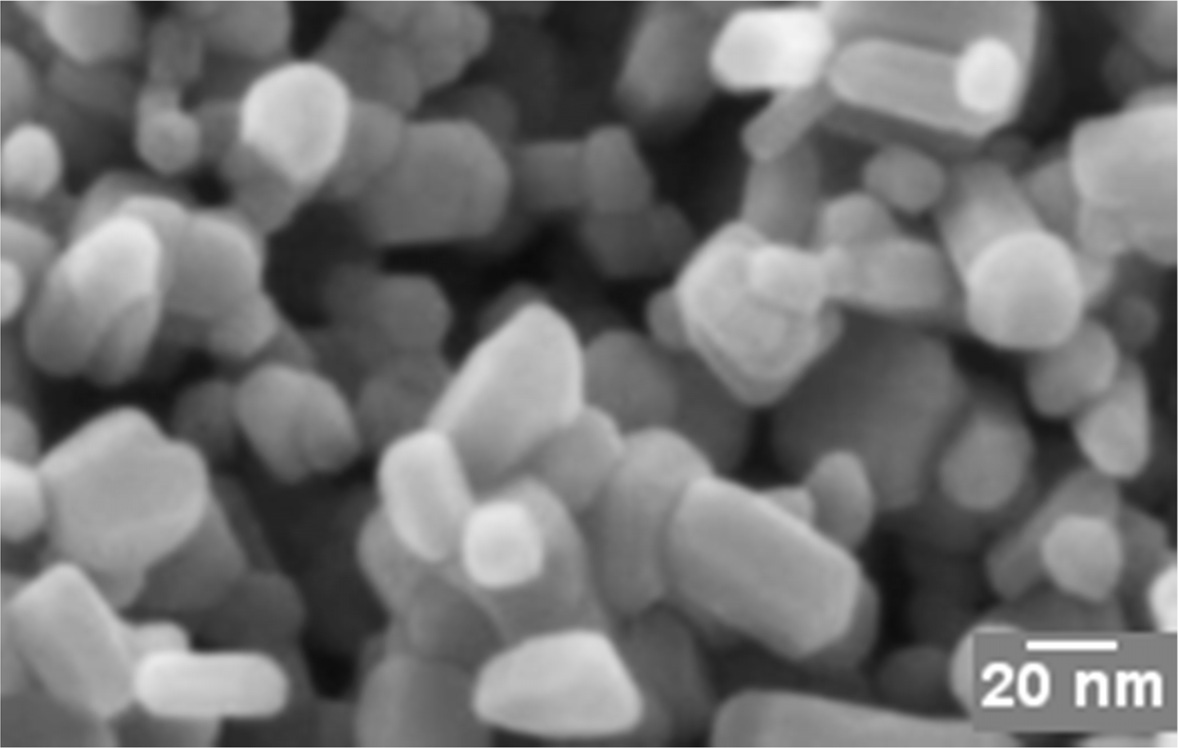
FESEM analysis of G-ZnO nanocomposite
FESEM of G-ZnO composite is shown in Fig. 2. These results show the development of ZnO on graphene matrix. The wrinkled structure of graphene sheets was well decorated with ZnO nanoparticles with an average particle size of 50 nm along with a few nanorods. This data again suggested, but do not prove, the presence of individual sheets in our compact GO materials.
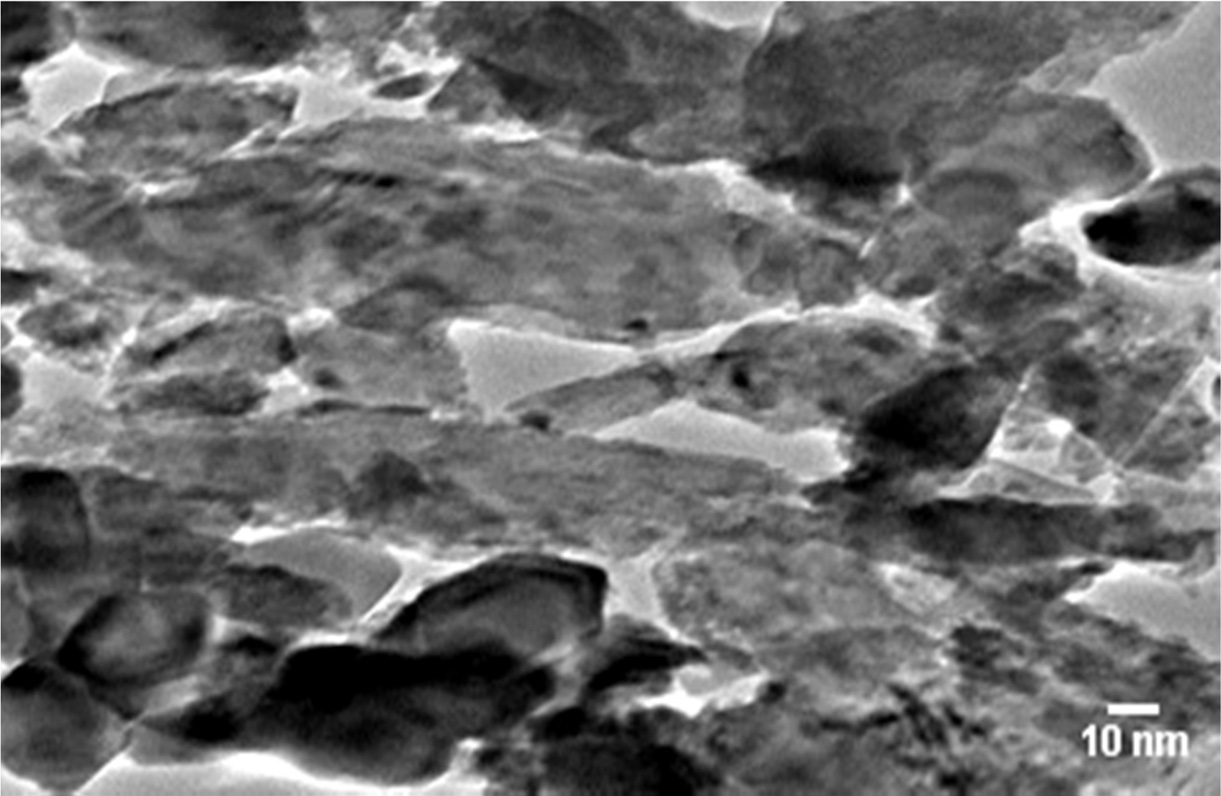
HRTEM analysis of G-ZnO nanocomposite
The average size of the particle was observed to be 5 ±0.3 nm AS calculated from (TEM). The HRTEM micrograph (Fig. 3).
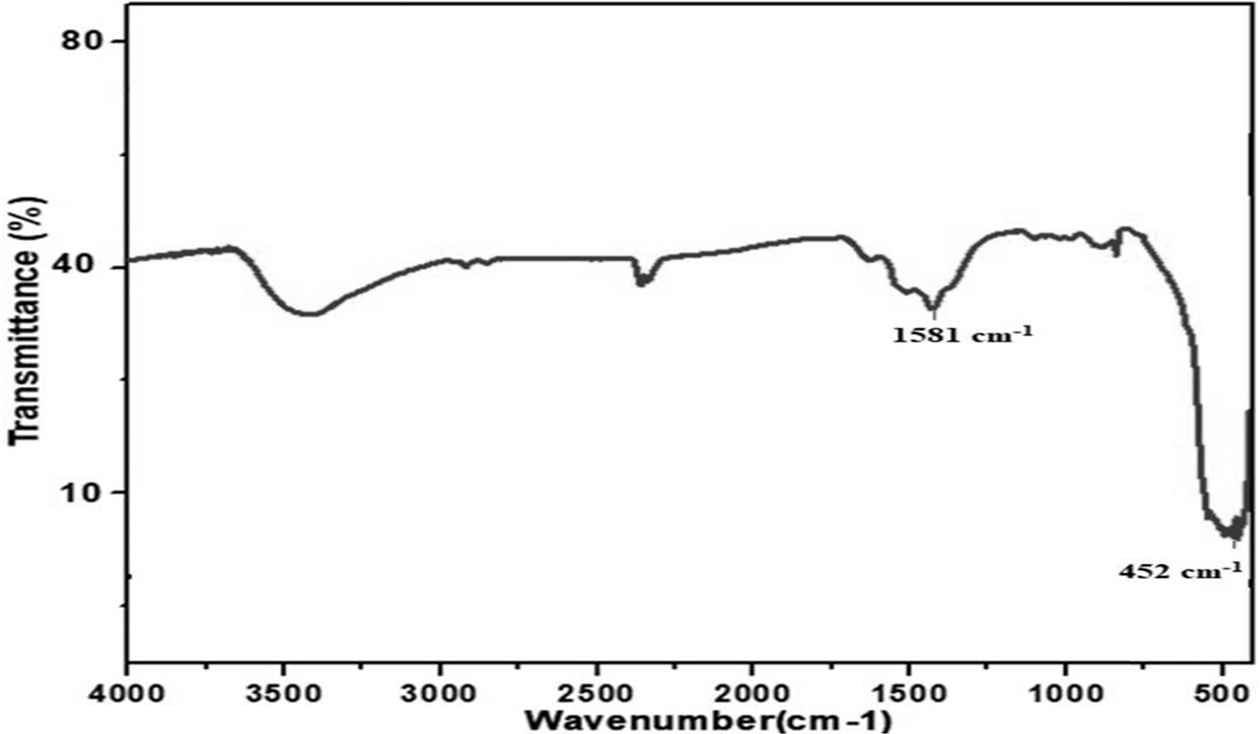
FTIR analysis of G-ZnO composite
The FTIR spectra of G-ZnO composite is shown in Fig. 4. The spectrum of G-ZnO displayed the characteristic absorption bands corresponding to various oxygen-containing functional groups. In the case of G-ZnO composite, it could be observed that the oxygen functional groups were almost reduced, which indicated the reduction of GO during the reaction process. The absorption peak at 1581 cm-1 and 452 cm-1 indicated the skeletal vibration of graphene sheets and stretching vibration of Zn-O.
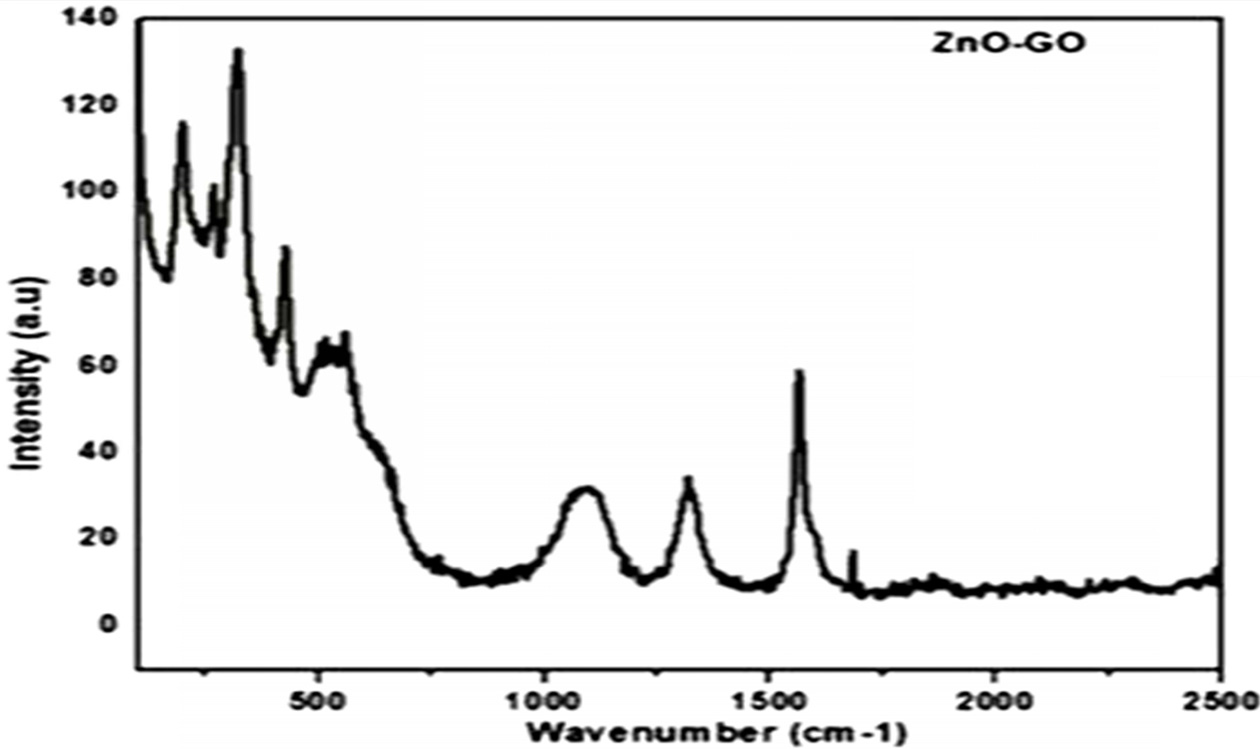
Raman spectroscopy analysis
Raman spectroscopy is one of the important characterization tool to examine the ordered/disordered structures of carbon-based materials. From Fig. 5 two characterization peaks can be observed one at 1344 cm-1 which can be indexed to local defects and another peak at 1582 cm-1 which is attributed to sp2 hybridized graphite structure. The peaks at 1344 and 1582 cm-1 reveal the presence of D and G-bands respectively. The change in Id/Ig ration from GO to G-ZnO nanocomposite can be observed which may be due to the formation of some additional sp2 during the synthesis process. It can be observed from the literature that the number of layers of Graphene can be determined from the peak position of G and D bands respectively.
Burning rate test
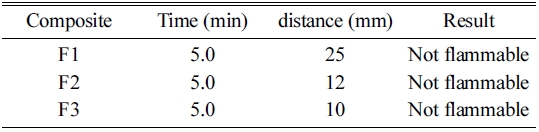
Test composite was filled loosely into an aluminum mold 250 mm long with a triangular cross- section of inner height 10 mm and width 20 mm. On both sides of the mold in an exceedingly longitudinal direction, two metal plates were mounted 2 mm beyond the upper edge of the triangular cross section. The mold was then being dropped 3 times from a height of 2 cm onto a solid surface. A non-combustible, non- porous and low heat conducting base plate was placed on the top of the mold. The mold was then removed by the inversion of the apparatus. A hot flame from a burner at a minimum diameter of 5 mm was used to ignite the pile at one end. The time and the distance traveled were given in Table 2.
The Limit of Oxygen Index (LOI) and UL-94V
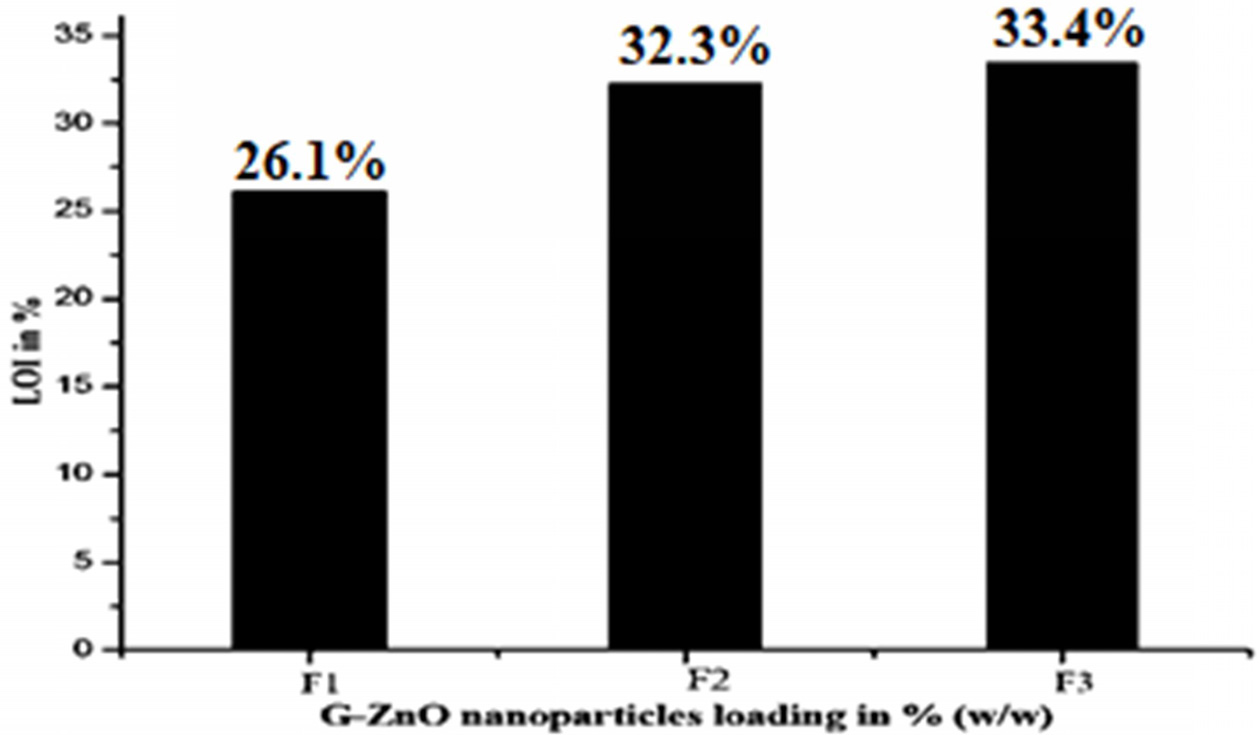
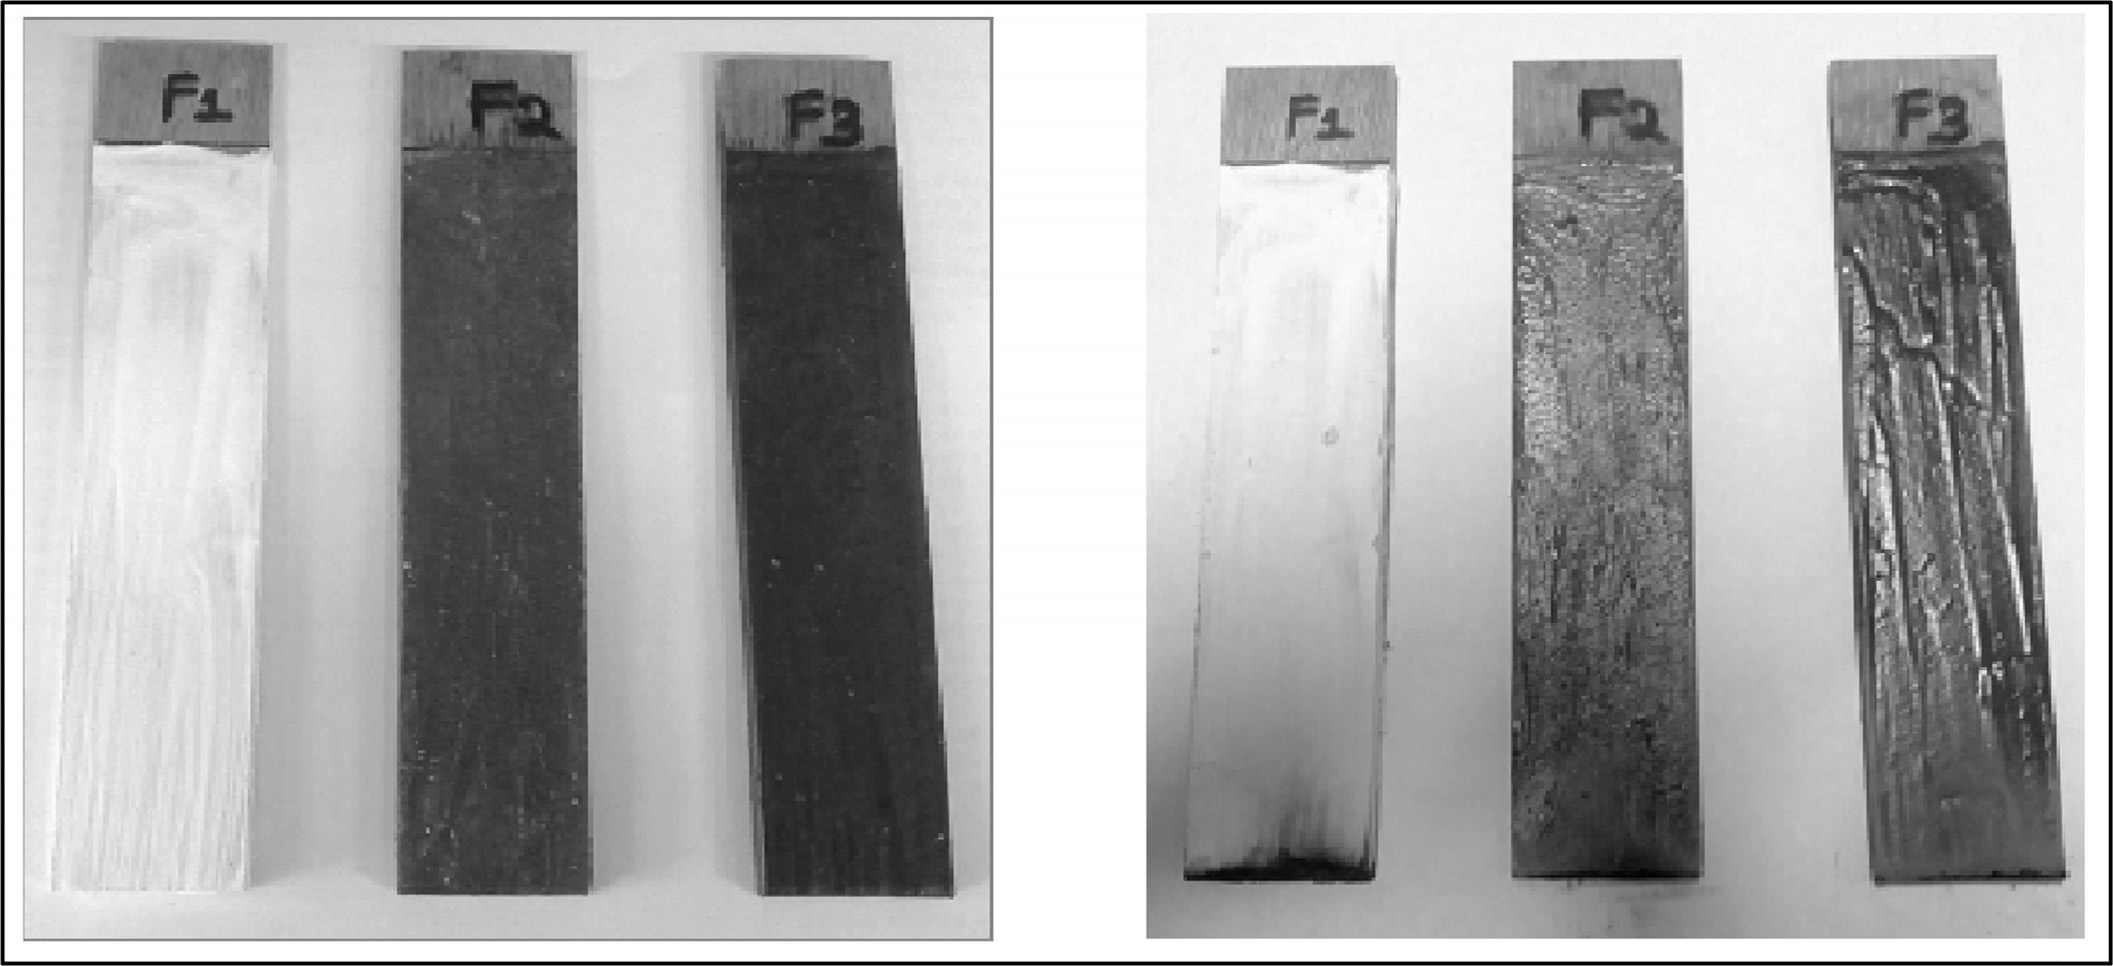
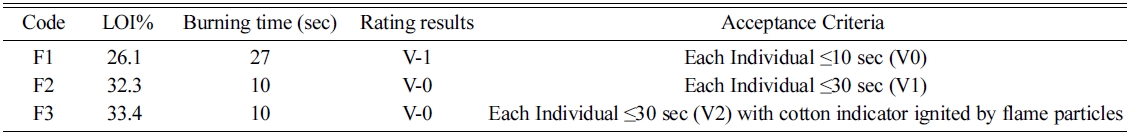
The LOI and UL 94 vertical burning tests were commonly used to evaluate the flame retardancy of materials. The results of the LOI and UL 94 tests for composites are presented in Table 3 and Fig. 6. And also the pictures of composites before and after performing the UL 94 test showed in Fig. 7. The LOI value of F1 composite is 26.1%, which indicated high inflammability of F1. When F1 was compounded with F2, the LOI value rose up to 32.3% and the UL 94 level can reach V-0. With the F2, the LOI value of F3 (33.4%) was much higher than those of F1 and F2.
The addition of G-ZnO nanoparticles remarkably increased the LOI values of composites, it is due to the G-ZnO nanoparticles undergoing endothermic decomposition by absorbing 445 J/G heat from the flame atmosphere to form water vapor, boric acid and forms a dense- boron oxide protective layer in between 290~450 ℃. This protective layer acts as a barrier to stop the tunneling of oxygen and flame towards the material. The released vapor from this mechanism also depletes the atmospheric oxygen and heat so the epoxy resin which exists beneath the protective layer remains safe.
Combustion test
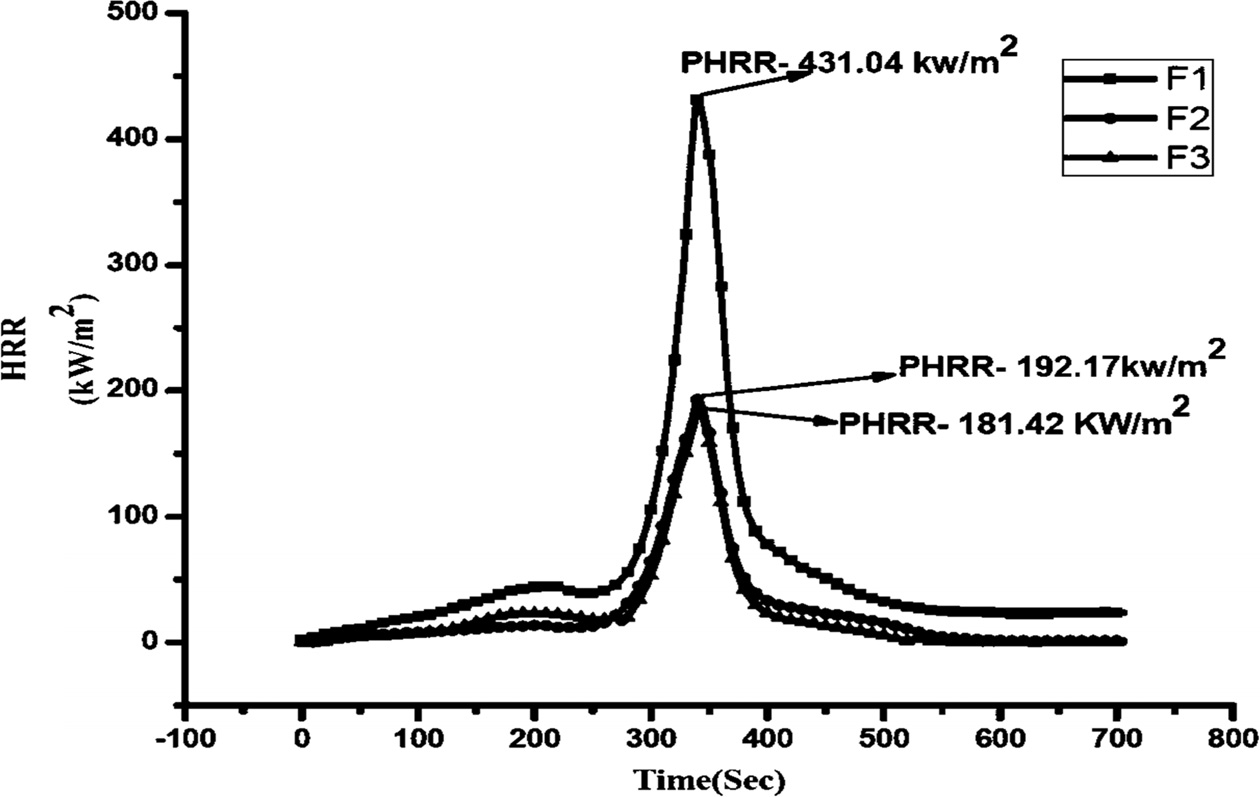
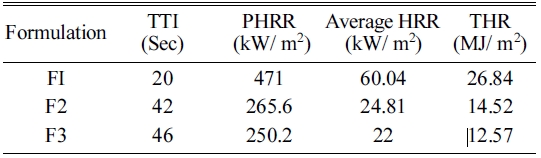
The combustion properties of materials were studied by the cone calorimeter. This study is used for the ranking and comparing the fire behavior of a material. From this study, parameters such as Peak Heat Release Rate (PHRR), Average Heat Release rate, Total Heat Release (THR) and Time to Ignition (TTI) can be obtained. PHRR is the fundamental and basic parameter to evaluate fire safety. PHRR values are considered useful for expressing fire intensity. The results are obtained in present work and presented in Table 3 and Fig. 8.
The combustion behavior of F1 composite effectively changed by adding G-ZnO nanoparticles. The pristine sample burnt very quickly after ignition and have showed HRR peak at the range of 250-450 seconds with 431.04 kW/m2 value. The addition of 1 and 2% of G-ZnO nanoparticles to the formulation, the PHRR values of the F2 and F3 composites decreased from 431.04 kW/m2 to 192.17 and 181.42 kW/m2 respectively. F1, F2, and F3 composites were obtained single peaks only. The G-ZnO nanoparticle involved in endothermal decomposition and released the moisture and formed a dense, boron oxide protective layer which protected the underlying material and improved the flame retardance.
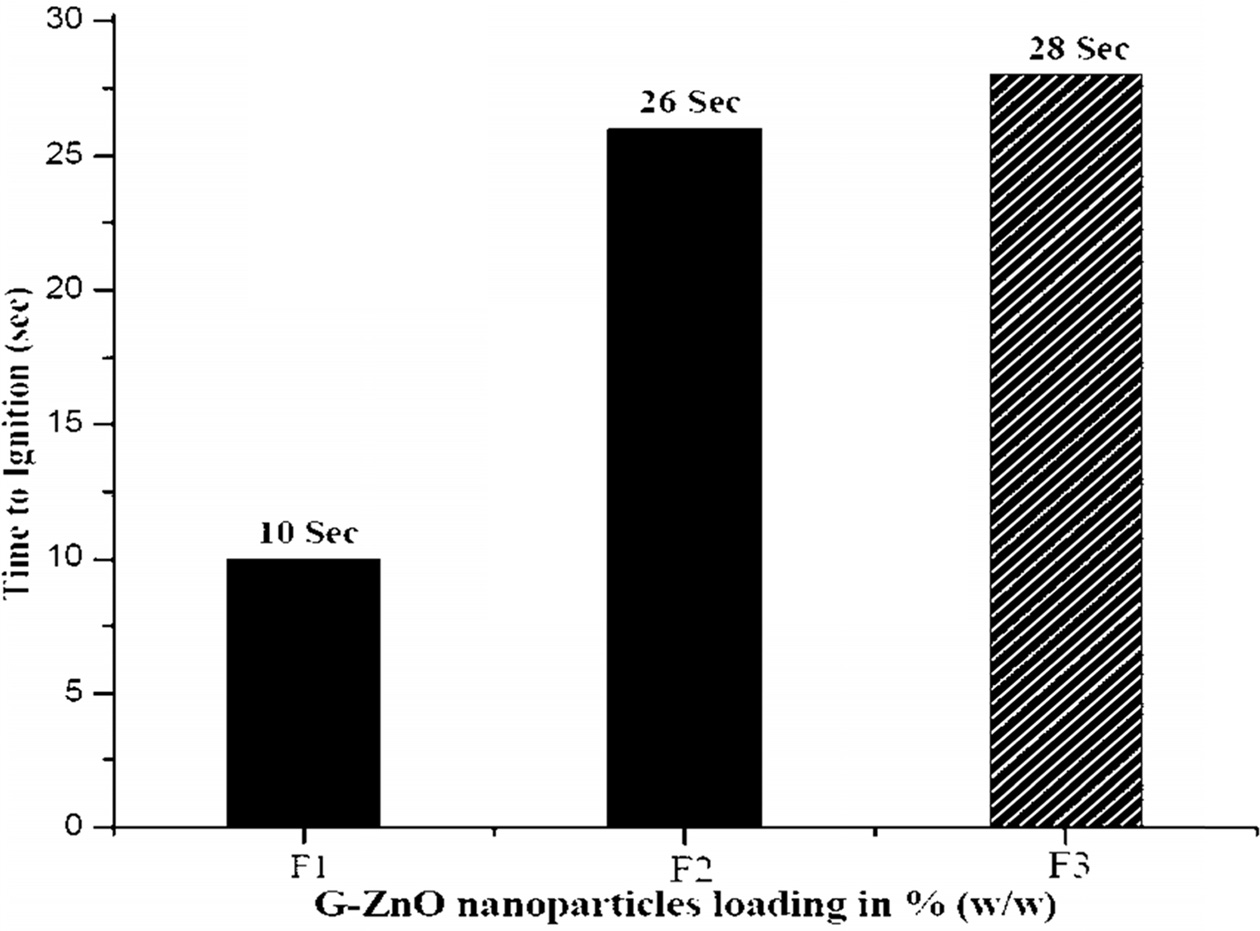
The TTI measures from the onset of HRR curves of a material. TTI parameter is used to evaluate the flame retardant influence on ignition of a material. Fig. 9 and Table 4 clearly indicated that the F1 ignited at 20 seconds of time whereas F2 and F3 composites ignited at 42 and 46 seconds respectively. The reason for this effect is the same as discussed in UL-94V test (Refer Section No. 4.8). From this Fig. 8, it can be seen that as the content of G-ZnO nanoparticle increased, it resulted in the increasing of TTI value of the composites effectively. According to Hapuarachchi et al. 2009 [25], the endothermic decomposition of a flame retardant additive capable of releasing moisture and absorbing heat in the material and results in the slowdown of the material decomposition process. This mechanism also results in the material temperature to be under the ignition temperature and finally improves the time to ignition values of the materials. From this data, it is clear that G-ZnO nanoparticles were able to impart a positive effect on composite to increase the time to ignition values effectively.
Thermal stability test
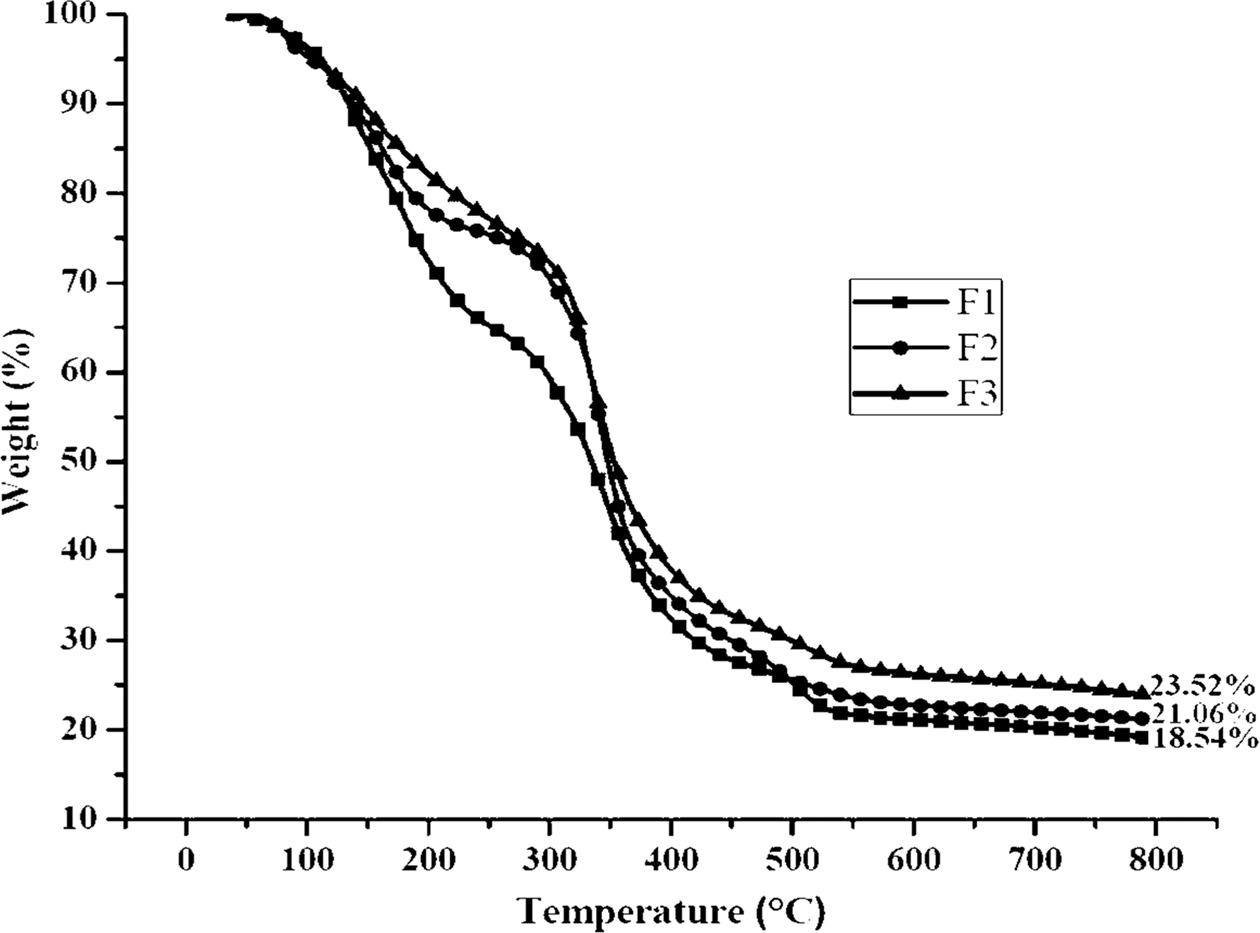
The thermal stability and decomposition pattern of F1 and composites of F2 and F3 were known through thermal gravimetric analysis (TGA) in the presence of nitrogen gas condition. TGA analysis was performed in the inert gas atmosphere for determination of the thermal degradation of the sample, because of using air or oxygen atmosphere the sample may get thermal oxidation.
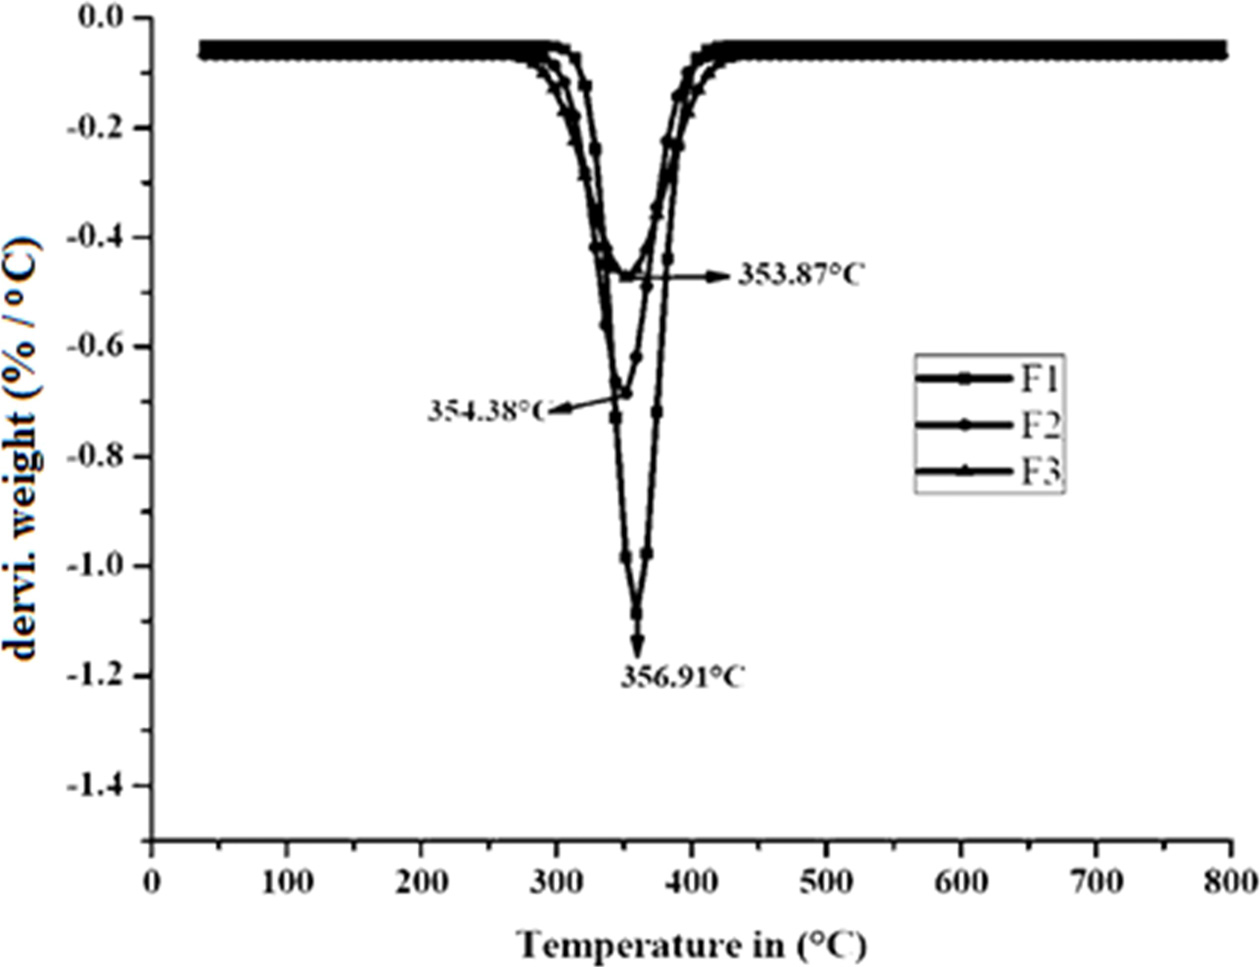
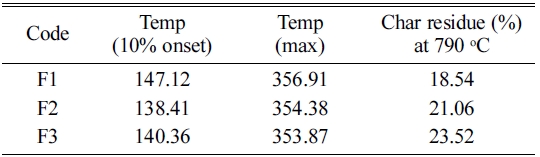
Fig. 10, Fig. 11 and Table 5 represent the TGA and Differential thermogravimetry (DTG) results of F1, F2, and F3 composites. From these data, it was shown that the F1 thermal decomposition started at 147.12 ℃ (10% onset Temperature) with a maximum temperature of 356.91 ℃. The F2 and F3 composites thermal decomposition (10% onset) temperatures were 138.41 ℃ and 140.36 ℃ respectively with maximum temperatures of 354.38 ℃ and 353.87 ℃ respectively. At 790 ℃ char residues of F1, F2 and F3 samples were 18.54, 21.06, and 23.52% respectively.
The thermal stability parameters of the composites greatly enhanced due to flame retardation action of G-Zn in both condensed and vapor phase.
|
Fig. 1 XRD pattern of G-ZnO composite. |
|
Fig. 2 Field Emission Scanning Electron Microscopy image of G-ZnO. |
|
Fig. 3 High-resolution transmission electron microscopy image of G-ZnO composite. |
|
Fig. 4 FTIR spectra of G-ZnO composite. |
|
Fig. 5 Raman Spectra of GO-ZnO nano composite. |
|
Fig. 6 Effect of G-ZnO nanoparticles on the LOI test. |
|
Fig. 7 Pictures of composites (a) is before and (b) is after UL 94 test. |
|
Fig. 8 Peak Heat Release Rate curves of the samples. |
|
Fig. 9 Time to Ignition values of the G-ZnO nanoparticle composites. |
|
Fig. 10 TGA graph of the composites. |
|
Fig. 11 DTG graph of the composites. |
The PHRR peak of the epoxy filled with functionalized G-ZnO nanoparticles was observed to decrease dramatically with increasing functionalized G-ZnO particle loadings. An increase in the LOI value was observed with the increase in wt% of G-ZnO nanoparticles. From the UL-94V data, it was confirmed that the F2 and F3 composites passed the flame test and were rated as V-0. The introduced of G-ZnO nanoparticles at a high percentage (2%) into epoxy resin could increase combustion results and thermal stability as obtained from the Cone-Calorimeter and TGA analysis. Overall, the addition of G-ZnO nanoparticles to epoxy resin can effectively improve the fire retardance of the composite, so it can be concluded that G-ZnO nanoparticles are recommended for the synthesis of fire retardant composite.
This work was supported by the National Research Foundation of Korea grant funded by the Korea government (No. 2018R1A6A1A03024509).
- 1. T.-A. Nguyen, H. Nguyen, T. Vuong Nguyen, H.Thai and Xianming Shi, J. Nanosci. Nanotechnol. 16 (2016) 9874-9881.
-

- 2. P. Saravanan, K. Jayamoorthy and S. Ananda Kumar, Journal of Science Advanced Materials and Devices. 1 (2016) 367-378.
-
- 3. Shuang Hu, Lei Song and Yuan Hu, "Polym .Plast. Technol. Eng. 52 (2013) 393-399.
-
- 4. Hammad Aziz and Faiz Ahmad, Prog. Org. coat. 101 (2016) 431-439.
-
- 5. Zhaolu Qin, Dinghua Li and Rongjie Yang, Polym. Degrad. Stab. 126 (2016) 117-124.
-
- 6. Z.Q. Lei, Y.M. Cao, F. Xie and H. Ren, J. Appl. Polym. Sci. 124 (2012) 781-788.
-
- 7. S. Zhang and A.R. Horrocks, Prog. Polym. Sci. 28 (2003) 1517-1538.
-
- 8. G. Camino, L. Costa and L. Trossarelli, Polym. Degrad. Stab. 7 (1984) 25-31.
-
- 9. H.J. Lin, H. Yan and B. Liu, Polym. Degrad. Stab. 96 (2011) 1382-1388.
-
- 10. C.X. Zhao, Y.T. Li and Y.L. Xing, J. Appl. Polym. Sci. 131 (2014) 40218.
-
- 11. G. Griffin, G, A. Bicknell and T. Brown, Journal of Fire Sciences. 23 (2005) 303-328.
-
- 12. M. Hassan, R. Kozlowski and B. Obidzinski, J. Appl. Polym. Sci. 110 (2008) 83-90.
-
- 13. J. Alongi, F. Bosco, F. Carosio, A. Di Blasio and G. Malucelli, Materials Today. 17 (2016) 152-153.
-
- 14. Y.Xiao, Y, Zheng, X.Wang, Z, Chen and Z. Xu, J. Appl. Polym. Sci. 131 (2014) 1-8.
- 15. B. Schartel, Materials. 3(10) (2010) 4710-4745.
-
- 16. C. Bao, Y. Guo, L.Song, Y. Kan, X. Qian and Y. Hu, J. Mater. Chem. 21 (2011) 13290-13298.
-
- 17. F.L. Jin, C. J. Ma and S. J. Park, Mater. Sci. Eng A. 528 (2011) 8517-8522.
-
- 18. C. H, Lin, C.S and Wang, Polymer. 42 (2001) 1869-1878.
-
- 19. C.A, Giudice and J.C. Benıtez, Prog. Org. Coat. 42 (2001) 82-88.
-
- 20. B.K. Kandola, A.R. Horrocks, P. Myler and D. Blair, J. Appl. Polym. Sci. 88 (2003) 2511-2521.
-
- 21. S.H. Liao, P.L. Liu, M.C. Hsiao, C.C. Teng, C.A. Wang and M.D. Ger, Ind. Eng. Chem. Res. 51 (2012) 4573-4581.
-
- 22. X. Wang, L. Song, W. Pornwannchai, Y. Hu and B. Kandola, Composites: Part A. 53 (2013) 88-96.
-
- 23. Z. Wang, P. Wei, Y. Qian and J. Liu, Composites: Part B. 60 (2014) 341-349.
-
- 24. A.P. Kumar, D. Depan, N.S. Tomer and R.P. Singh, Prog. Polym. Sci. 34 (2009) 479-515.
-
- 25. T.D. Haparachchci and T. Peijs, eXPRESS Polymer Letters. 3 (2009) 743-751.
-
 This Article
-
2019; 20(4): 411-417
Published on Aug 31, 2019
- Received on Apr 17, 2019
- Revised on Jun 7, 2019
- Accepted on Jul 5, 2019
Services
- Abstract
introduction
materials
experimental
results and discussion
conclusions
- Acknowledgements
- References
- Full Text PDF
Shared
Correspondence to
- Bon Heun Koo
-
School of Materials Science and Engineering, Changwon National University, Changwon, Gyeongnam, Republic of Korea
Tel : +82-55-264-5431
Fax: +82-55-262-6486 - E-mail: bhkoo@changwon.ac.kr
Clean-Energy Research Institute(CRI), Hanyang University, 222, Wangsimni-ro, Seongdong-gu, Seoul, 04763, Korea
E-mail: jcpr@hanyang.ac.kr