


- Effect of aggregates of elements induced by rare earth doping on toughening of tailing-derived glass-ceramics
Du Yongshenga, Ma Jiea, Zhang Xuefenga, Zhang Hongxiaa, Chen Huaa, Ouyang Shunlib and Baowei Lib,*
aCollege of Science, Inner Mongolia University of Science &Technology, Baotou 014010, China
bKey Laboratory of Integrated Exploitation of Bayan Obo Multi-Metallic Resources, Inner Mongolia University of Science and Technology, Baotou 014010, China
Tailings glass-ceramics doped with different proportion of CeO2 were prepared by conventional melts and controllable crystallization. The effect of CeO2 on the microstructure, element distribution characteristics and fracture toughness of glass-ceramics was studied in this paper. Significant change in microstructure was not observed with the addition of rare earth oxide, but the phenomenon of element aggregates begins to appear in glass-ceramics and the element enrichment of Si, Al, Na and Ce can be observed in the element aggregates. As a result, the integrity of the glass network structure can be improved and the strength of glass phase contributed to the enhancement of fracture toughness. The doping of 3.0% CeO2 achieved a remarkable improvement on fracture toughness that reached 2.86 MPa*m1/2 with a Vickers hardness of 8.49 GPa.
Keywords: Tailing, Glass-ceramics, Rare earth ions, Aggregate, Fracture toughness
The rapid increases in emissions of solid waste have brought great harm to environment. The development of glass-ceramics prepared using various solid wastes with high mechanical properties, such as high flexural strength and hardness, high thermal stability, excellent chemical resistance and abrasion resistance, is one of the hot topic because of these materials’ wide range of applications [1-3]. For instance, glass-ceramics can be widely used in the field of metallurgy, mining, electric power, chemical industry, etc [4-6]. However, the small fracture toughness of glass-ceramics greatly restricts its further commercial service because of the brittleness. It is undoubted that the improvement of fracture toughness will greatly broaden the application of glass-ceramics. As mentioned before, in order to change the micro-structure and/or eliminate the defects of glass-ceramics, a comprehensive study on adjusting the composition and optimizing the heat treatment have been carried out to improve the fracture toughness. Meanwhile, the other methods, including fiber toughening, whisker toughening, metal particle toughening, ZrO2 toughening and self toughening, have been applied and made the better effect [7-9]. Especially, rare earth ion with high cationic field strength tends to bring obvious aggregation effect in glass-ceramics, which can induce the element redistribution and improve the physicochemical properties of glass-ceramics. For instance, it was expected that the micro-hardness, caused by the controlled microstructure, was improved by the doping of CeO2, Nd2O3, Sm2O3 and Gd2O3 into mica glass-ceramics due to the strength field of Ce4+, Nd3+, sm3+ and Gd3+ ions [10]. H. Abdoli et al. investigated the hardness and fracture toughness of La- and Y-containing glass-ceramics. It was found that the higher stiffness, hardness and fracture toughness exhibited in La-containing glass-ceramics [11]. It was related to the in-situ toughening mechanism. Moreover, the aggregation effect, induced by the high electric field characteristics of rare earth, was the main reason for densifying the glass network structure or changing crystal morphology, namely the rare-earth elements toughening of glass-ceramic. Furthermore, in order to reveal the nature of rare earth toughening in glass-ceramics, the distribution of relevant element is conducive to investigate the propagation path of cracks in the rich rare-earth region. Unfortunately, the fact that governed generation and evolution of crack by the distribution of relevant element, resulting from the rare earth ions, in tailings glass-ceramic is still less studied at present. Therefore, in order to enhance the toughness of glass-ceramics, it is essential to investigate the evolution law of element aggregation induced by rare earth ion deeply.
In the previous research, the effects of tailing glass-ceramics with different contents of rare earth oxides on crystallization characteristics, element distribution and crack propagation were investigated [12]. It was found that the glass-ceramic with the other additive prepared by melting possess more perfect characteristics of fracture toughness than the matrix. In view of the above mentioned facts, in the present work, the glass-ceramic, as matrix phase, with x wt% CeO2 (x = 0, 1, 3) as additive were prepared by melting, and their fracture toughness characteristics and microstructure were investigated. Furthermore, it is also expected that relationship between the fracture toughness with their microstructure feature can be revealed.
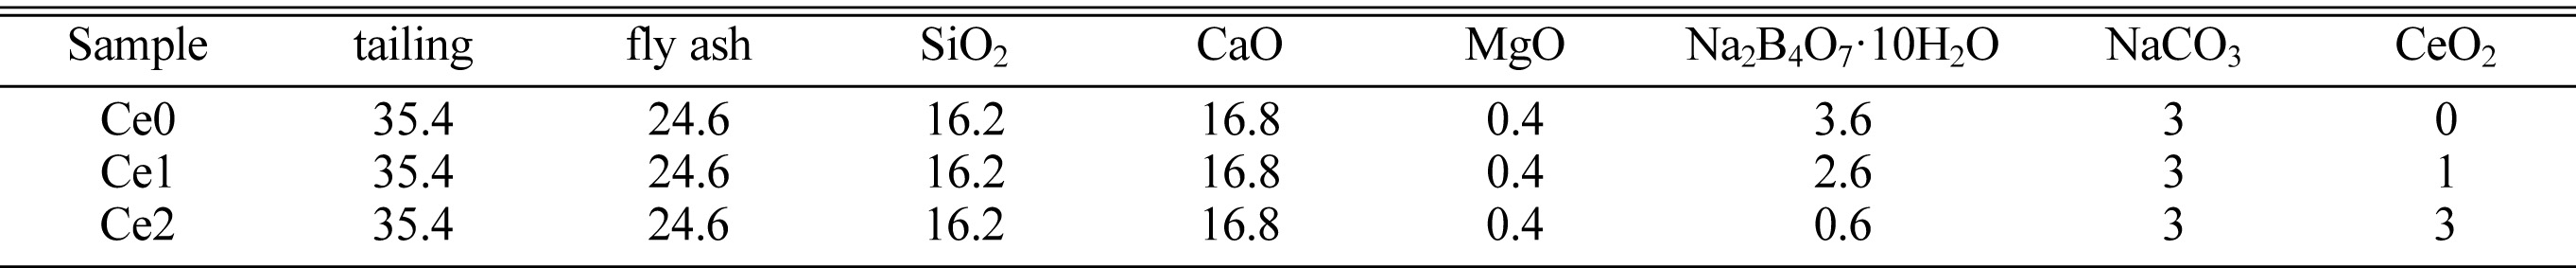
Target compositions of three groups of glass-ceramics with different CeO2 additions (sample nos.Ce0, Ce1 and Ce2) had been given in Table 1, while the major chemical compositions of tailing and fly ash can be found in our previous study [12]. Taking into account the component features of tailing, fly ash and the type of main crystalline phase, the designed basic glass component of glass-ceramics was chosen as 42.60% SiO2, 27.20% CaO, 3% MgO and 7% Al2O3 (weight ratio). Meanwhile, a small amount of SiO2, CaO and MgO (chemical grade) were added since tailing and fly ash cannot provide sufficient basic glass component.
The preparation process of glass-ceramics included glass melting, annealing, stage of nucleation and crystallization. First of all, raw materials powders by ball milling were melted in corundum crucible at 1450 oC for 3 h, and then the homogeneously mixed melts were cast into rectangular stainless steel mold and the specimens were annealed at 600 oC for 2 h so as to reduce residual stress. The residue melts were quenched in water and crushed into powders, determining the appropriate temperature for heat treatments by DSC measurement. Then, the samples can be obtained by means of controlled nucleation and crystallization.
DSC measurements (NETZSCH DSC 404 F3) was used to determine the thermo behaviors of the parent glasses and to confirm the nucleation and crystallization temperature, applying the heating rate of 10 ºC/min. The crystalline structure and phase constituents of the glass–ceramics were recorded on powder XRD (Bruker diffractometer, AXS D8ADVANCED). FESEM (Philips, QUANTA 400) with EDS apparatus were performed to observe the morphology and chemical composition of glass-ceramics. For the morphology analysis, the surfaces of the glass-ceramics were firstly polished and etched with 5 wt.% hydrofluoric acid for 75 s and then sprayed with gold. The elemental analysis did not pass through the corrosion process. Measurement of crack propagation and microhardness of glass-ceramics was estimated using vickers hardness tester (HV-SOA) under an indentation load of 4.9 N for a 10 s dwell time on flat polished surface and six indentation experiments were performed to obtain the average value. Young's modulus of the glass–ceramics was measured using resonant ultrasound spectroscopy (RUS). The linear coefficient of thermal expansion (CTE) were measured with a dilatometer (ZRPY-1400) from room temperature to 600 oC in air, with a heating rate of 5 oC/min. The dilatometry samples were prepared as rectangular bars (4×5×50 mm). The Raman spectra were obtained in the range 200-1200 cm−1 under an excitation wavelength of 532 nm and an output power of 25 mW using a Raman spectrometer (Jobin Yvon, HR 800).
DSC measurements (NETZSCH DSC 404 F3) was used to determine the thermo behaviors of the parent glasses and to confirm the nucleation and crystallization temperature, applying the heating rate of 10 ºC/min. The crystalline structure and phase constituents of the glass–ceramics were recorded on powder XRD (Bruker diffractometer, AXS D8ADVANCED). FESEM (Philips, QUANTA 400) with EDS apparatus were performed to observe the morphology and chemical composition of glass-ceramics. For the morphology analysis, the surfaces of the glass-ceramics were firstly polished and etched with 5 wt.% hydrofluoric acid for 75 s and then sprayed with gold. The elemental analysis did not pass through the corrosion process. Measurement of crack propagation and microhardness of glass-ceramics was estimated using vickers hardness tester (HV-SOA) under an indentation load of 4.9 N for a 10 s dwell time on flat polished surface and six indentation experiments were performed to obtain the average value. Young's modulus of the glass–ceramics was measured using resonant ultrasound spectroscopy (RUS). The linear coefficient of thermal expansion (CTE) were measured with a dilatometer (ZRPY-1400) from room temperature to 600 oC in air, with a heating rate of 5 oC/min. The dilatometry samples were prepared as rectangular bars (4×5×50 mm). The Raman spectra were obtained in the range 200-1200 cm−1 under an excitation wavelength of 532 nm and an output power of 25 mW using a Raman spectrometer (Jobin Yvon, HR 800).
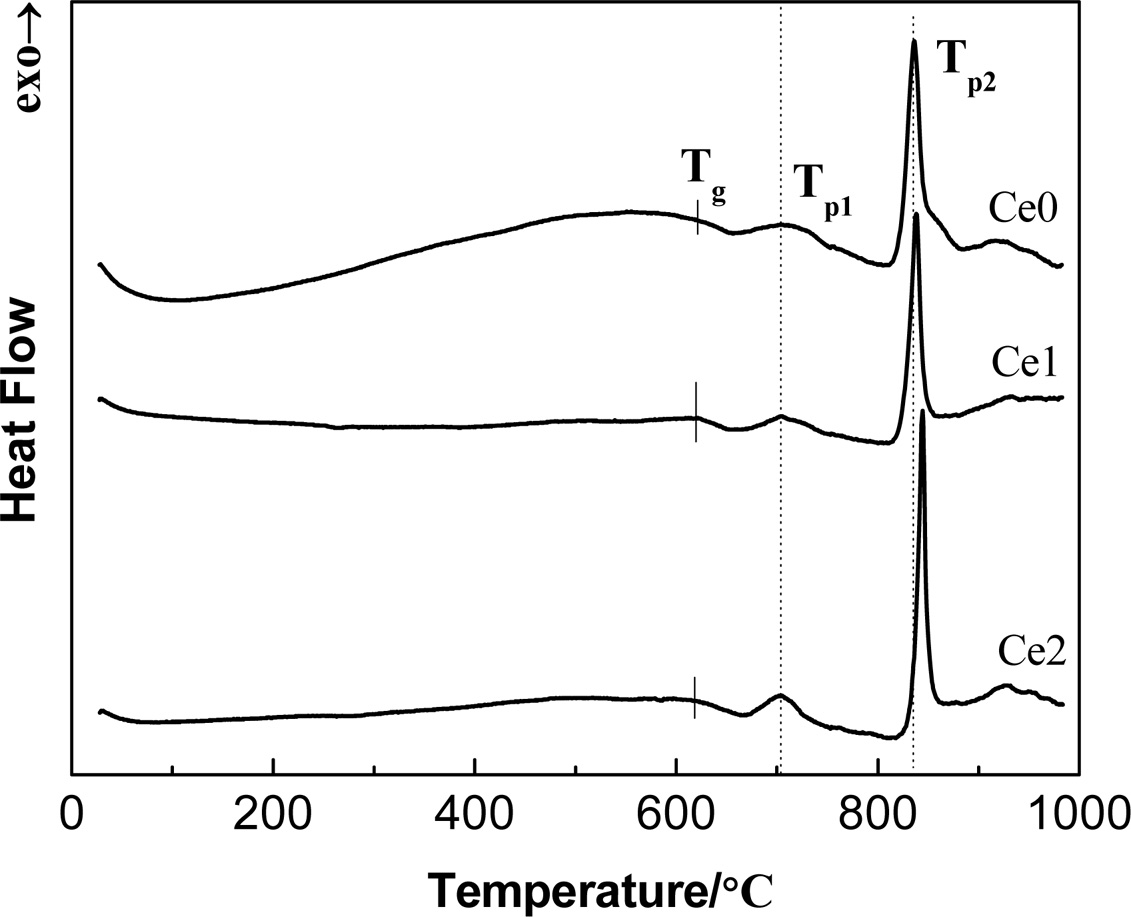
Fig. 1 presents the DTA profile of as-cast glasses with different CeO2 addition. All the compositions exhibit an endothermic peak associated with the glass transition and two exothermic peaks associated with the nucleation and crystallization. The small broad exothermic peak at about 707 oC is believed to be caused by the production of a large number of nucleation centers, which can be considered as the appearance of nucleation phase. The strongest exothermic peak turns up at the temperature near 836 oC, which means the precipitation of main crystalline phase. Thus, heating treatment 720 oC/2h for nucleation and 850 oC/2h for crystallization are chosen to serve. Furthermore, the thermal stability of glass can be appropriately calculated via the temperature difference between Tp2 and Tg (ΔT = Tp2 - Tg) and the result is listed in Table 2. It can be found that the thermal stability of glass is improved with the increases of content of rare earth [13]. This phenomenon can be explained as follows. The high electric field characteristic of rare earth ions tends to produce aggregation effect in glass-ceramics, which is helpful to densify glass network structure.
|
Fig. 1 DTA curves of CeO2 doped as-cast glasses at a heating rate of 10 K/min. |
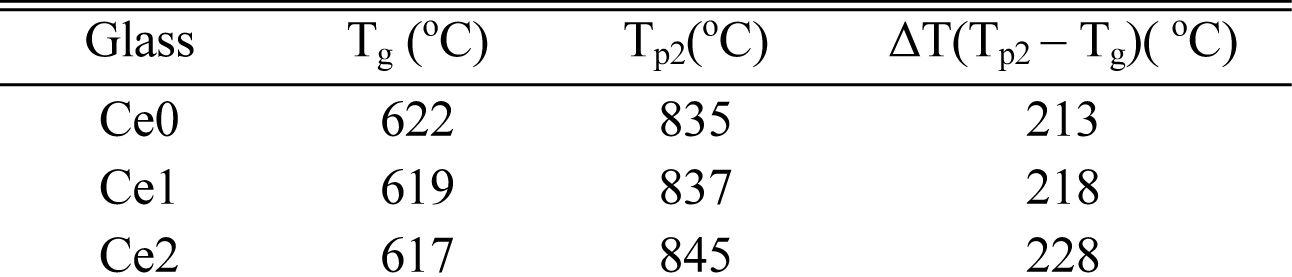
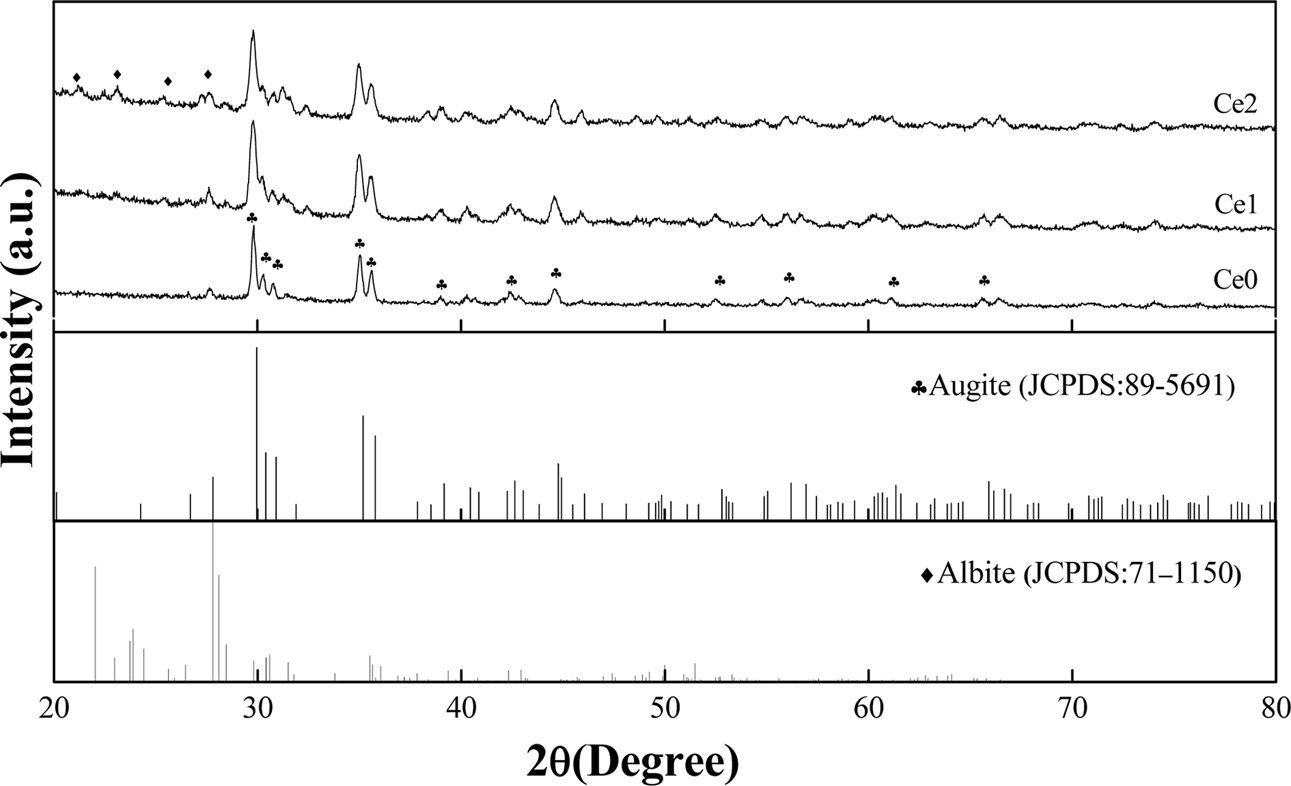
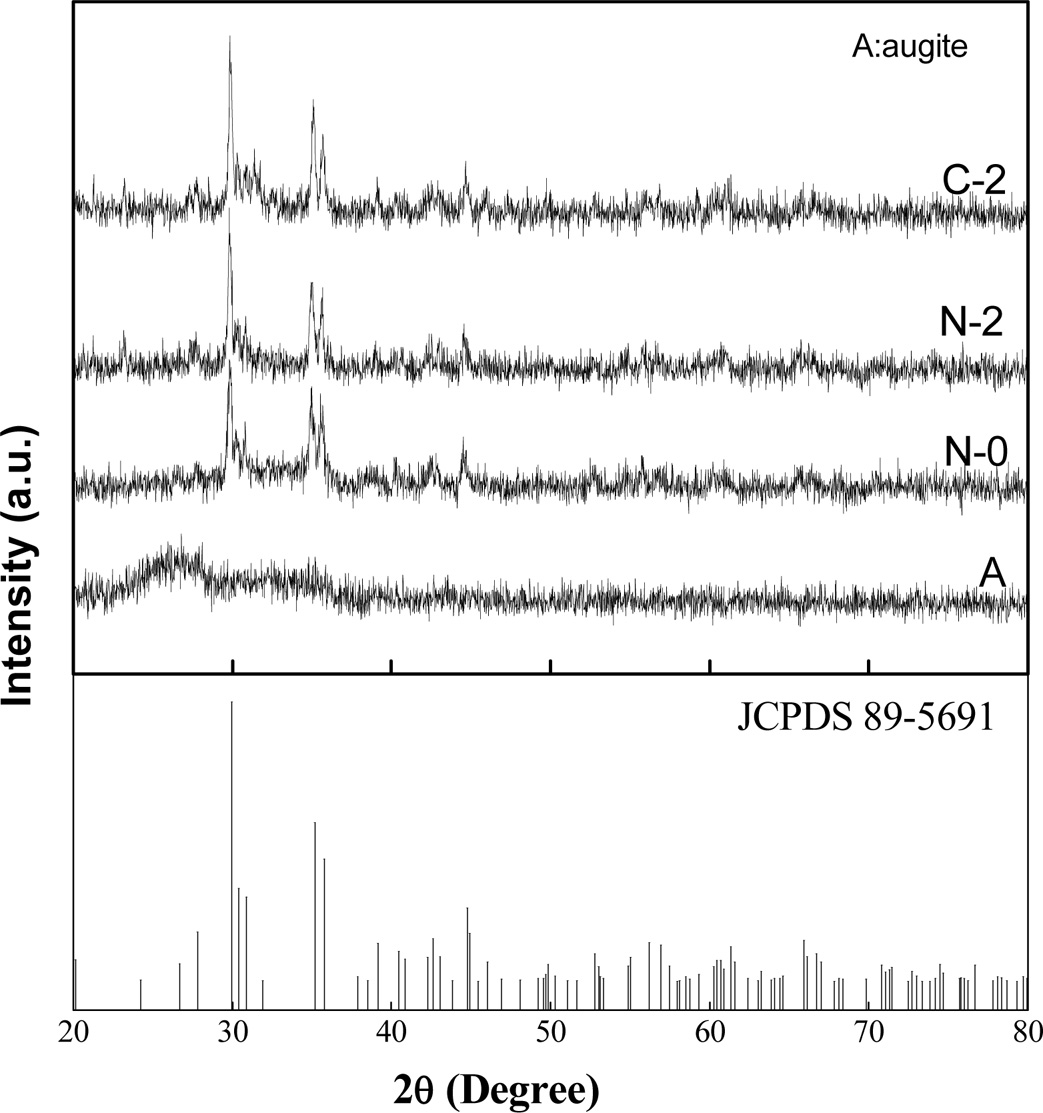
The effect of different rare earth additions on the crystalline structure of glass-ceramics is shown in Fig. 2. It can be seen that augite (JCPDS 89-5691) is indexed as the main crystalline phase and the additions of rare earth ions hardly change the crystalline phase of glass-ceramic. Furthermore, the Bragg peak positions of the main phase show no shift with the addition of rare earth. K.Yang et al. reported a tendency of peak position in main crystal phase of BaO-K2O-Nb2O5-SiO2 glass-ceramic shifting to high diffraction angles with an increment of Gd2O3 and the reason can be explained by substitution of Ba2+ and K+ by Gd3+ in crystal phases, which resulted in the reduction of lattice parameters [14]. In our experiments, the invariance of crystal type and lattice parameter with the addition of rare earth indicates that rare earth may not enter into the main crystalline phase, and rare earth ion is mainly distributed in the glass phase. It is also worth noting that albite (Na(AlSi3O8)) crystalline phase can also appears with the increase of rare earth. The high electric field characteristics of rare earth ion is beneficial to the aggregation of Si4+, Al3+ and Na+ ions in glass phase since Si and Al can be regarded as main glass network forming oxides in glass-ceramic and the negative charge of [AlO4]- can be balanced by Na+ [15-16]. As a result, the formation of albite may be due to the precipitating of Na+ and Al3+ ions combined with Si4+ ions under the high electric field of rare earth ion.
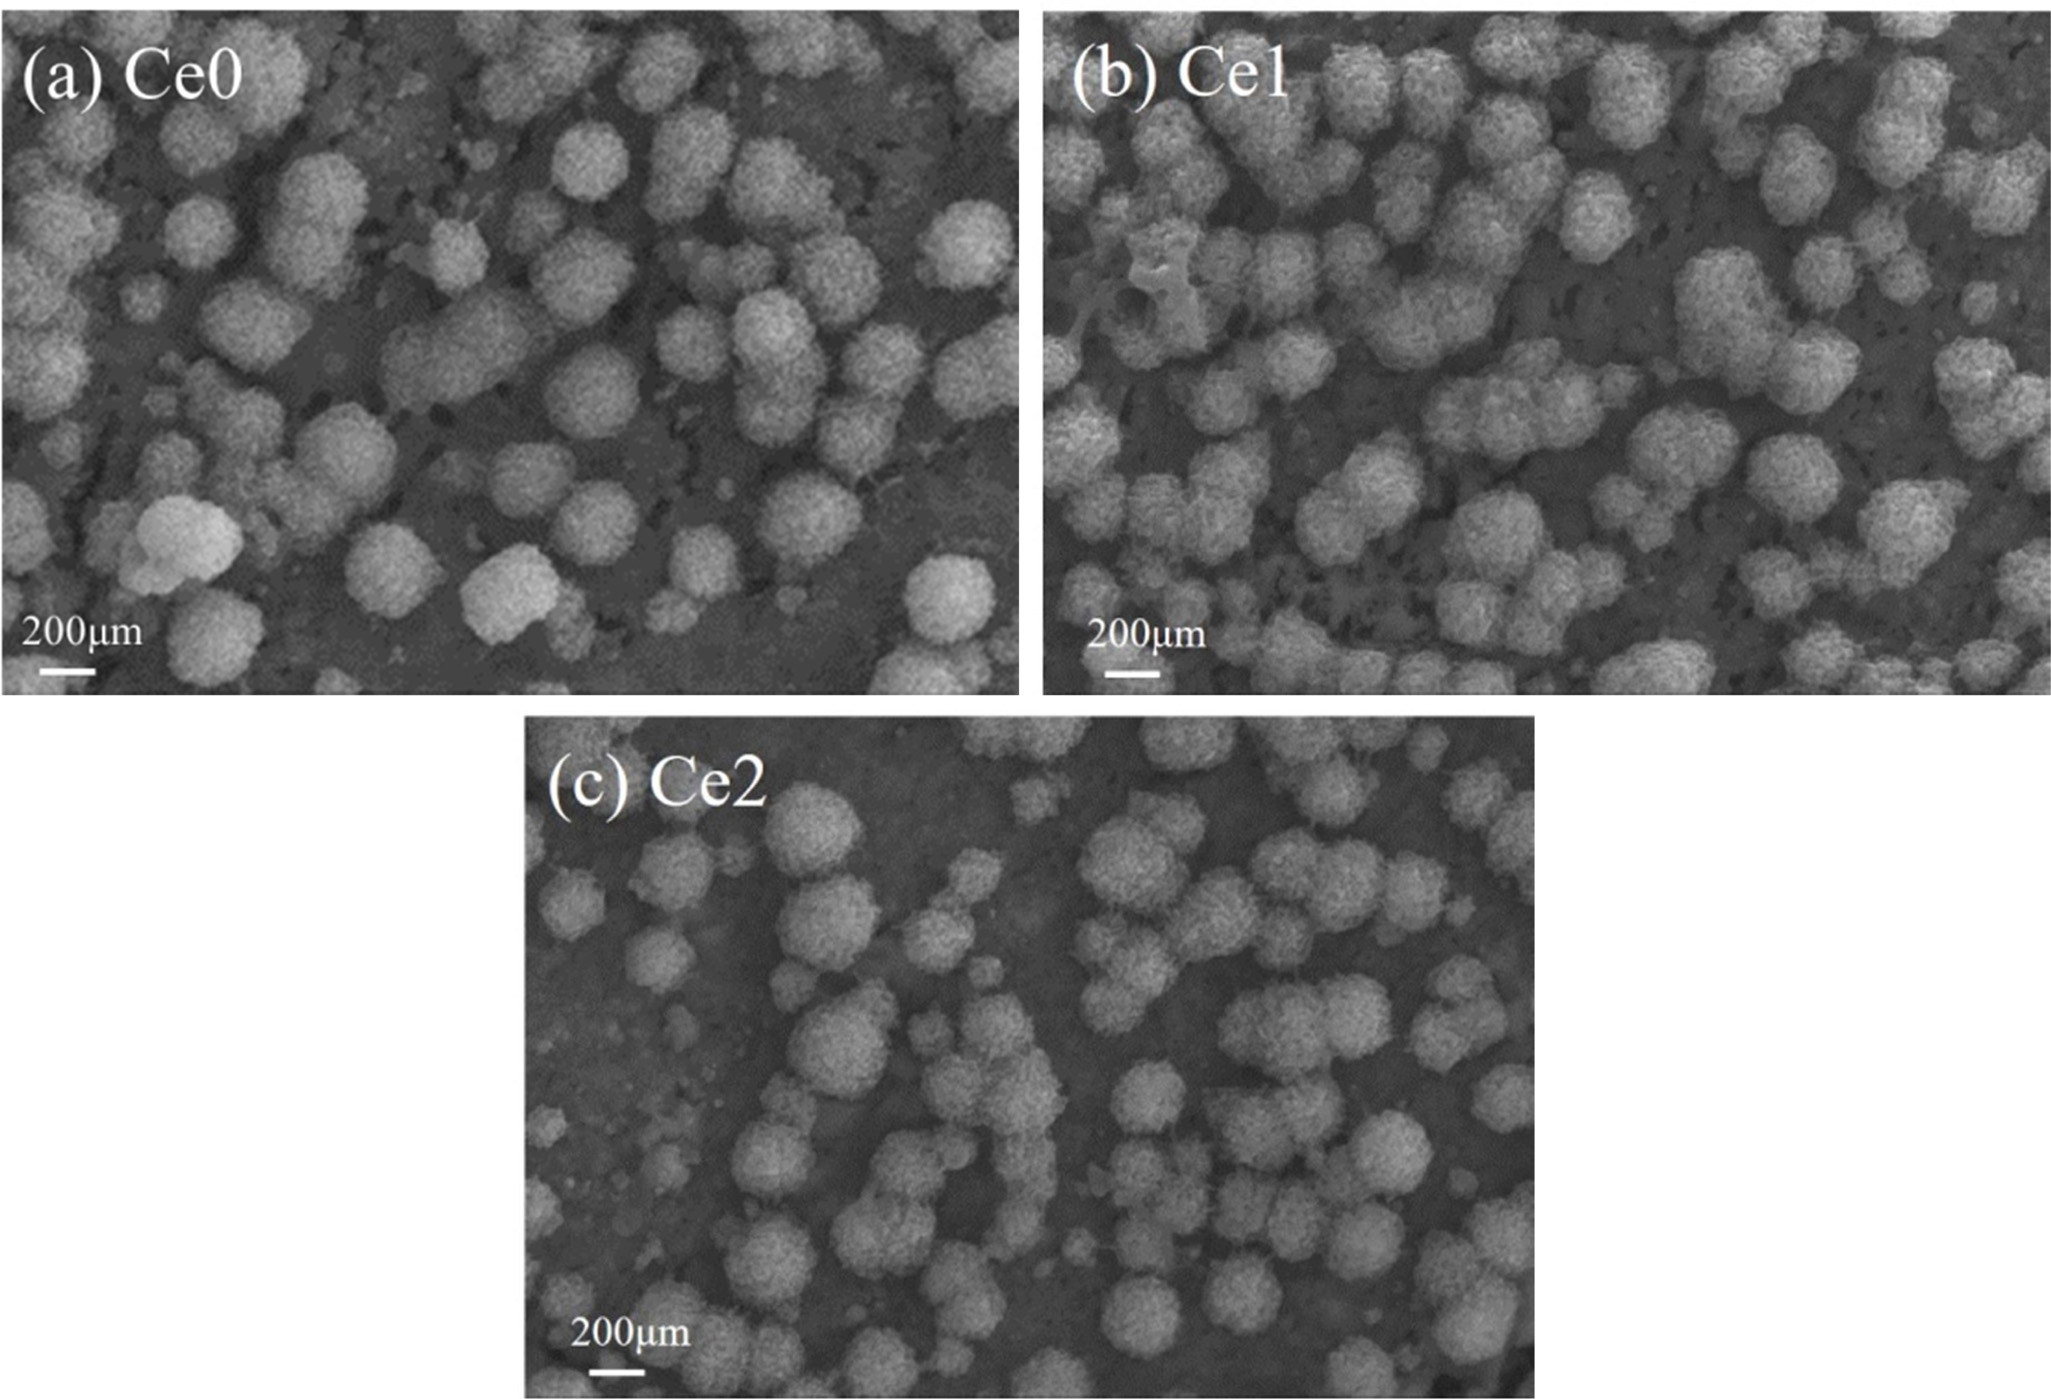
Fig. 3 shows the scanning electron microscopy micrographs of the polished and etched surface of the samples with different CeO2 additions. Because of sufficient nucleating agents provided by Bayan Obo tailing, it can be seen that the crystalline phase in glass-ceramics is augite with large numbers of spheroidal crystals embed in glass matrix and the average size is about 200-300 nm [17]. Crystal morphology and crystalline degree of glass-ceramics hardly change with the addition of CeO2, which is consistent with the XRD result. However, rare earth has a significant effect on the structure of glass phase in glass-ceramics. The characteristic features of obvious voids found in sample Ce0 and Ce1 are presented in Fig. 3(a)-(b), and this phenomenon is mainly due to the acid solution of large numbers of metal ions intergrowths in tailings, such as Fe3+ and Na+. By contrast, the sample Ce2 does not demonstrate such voids after the sample have been etched. In general, the corrosion resistance of glass phase is weaker than that of crystalline phase. In particular, the integrity of the glass network structure can be seriously damaged by the intergrowth of metal ions in tailing-derived glass-ceramics, which can further decrease the acid-corrosion resistance of glass-ceramics. Rare earth ion with high cationic field strength tends to bring obvious aggregation effect in glass phase, which may induce the aggregation containing different metal ions [18]. As a result, the integrity of the glass network structure can be improved and the acid-resistance of glass-ceramic is strengthened which can be proved by the gradual decrease in the voids.
|
Fig. 2 XRD spectra of glass-ceramics with different CeO2 content. |
|
Fig. 3 SEM micrographs of etched (with 5% hydrofluoric acid for 75 s) samples. |
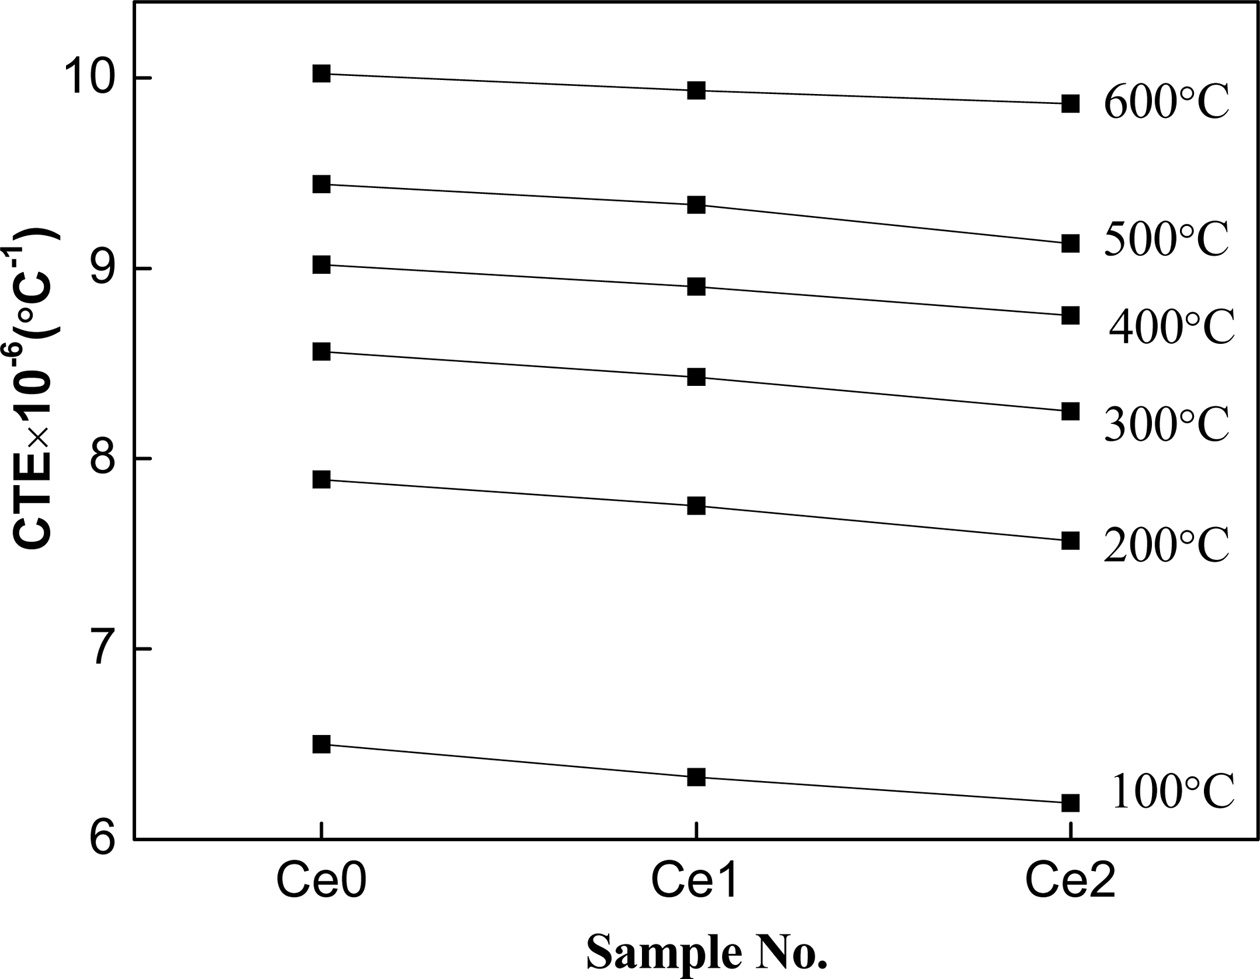
The CTE of glass-ceramics with the amount of rare earth oxides, CeO2, at the increasing temperature is shown in Fig. 4. It can be found that the CTE of glass-ceramics, determined by the crystal structure and interatomic force [19], decreases with the increase of the content of rare earth ions in which the rigidity of the glass network of glass decrease. However, the CTE of the glass-ceramic increases with the crystallinity in which the crystal phases with a high CTE values formed. The reason can be explained by the fact that the modifying cations, Ce2+, with high cationic field strength occupy the network-modifying positions tends to bring obvious aggregation effect in glass phase that is favored by an increase of rigidity of the glass network in amorphous phase and a decrease of structure of non-bridge oxygen [20]. As a result, the rigidity of the glass network was decreased by introducing non-bridging oxygen ions.
|
Fig. 4 Thermal expansion characteristics of glass-ceramics with different CeO2 content. |
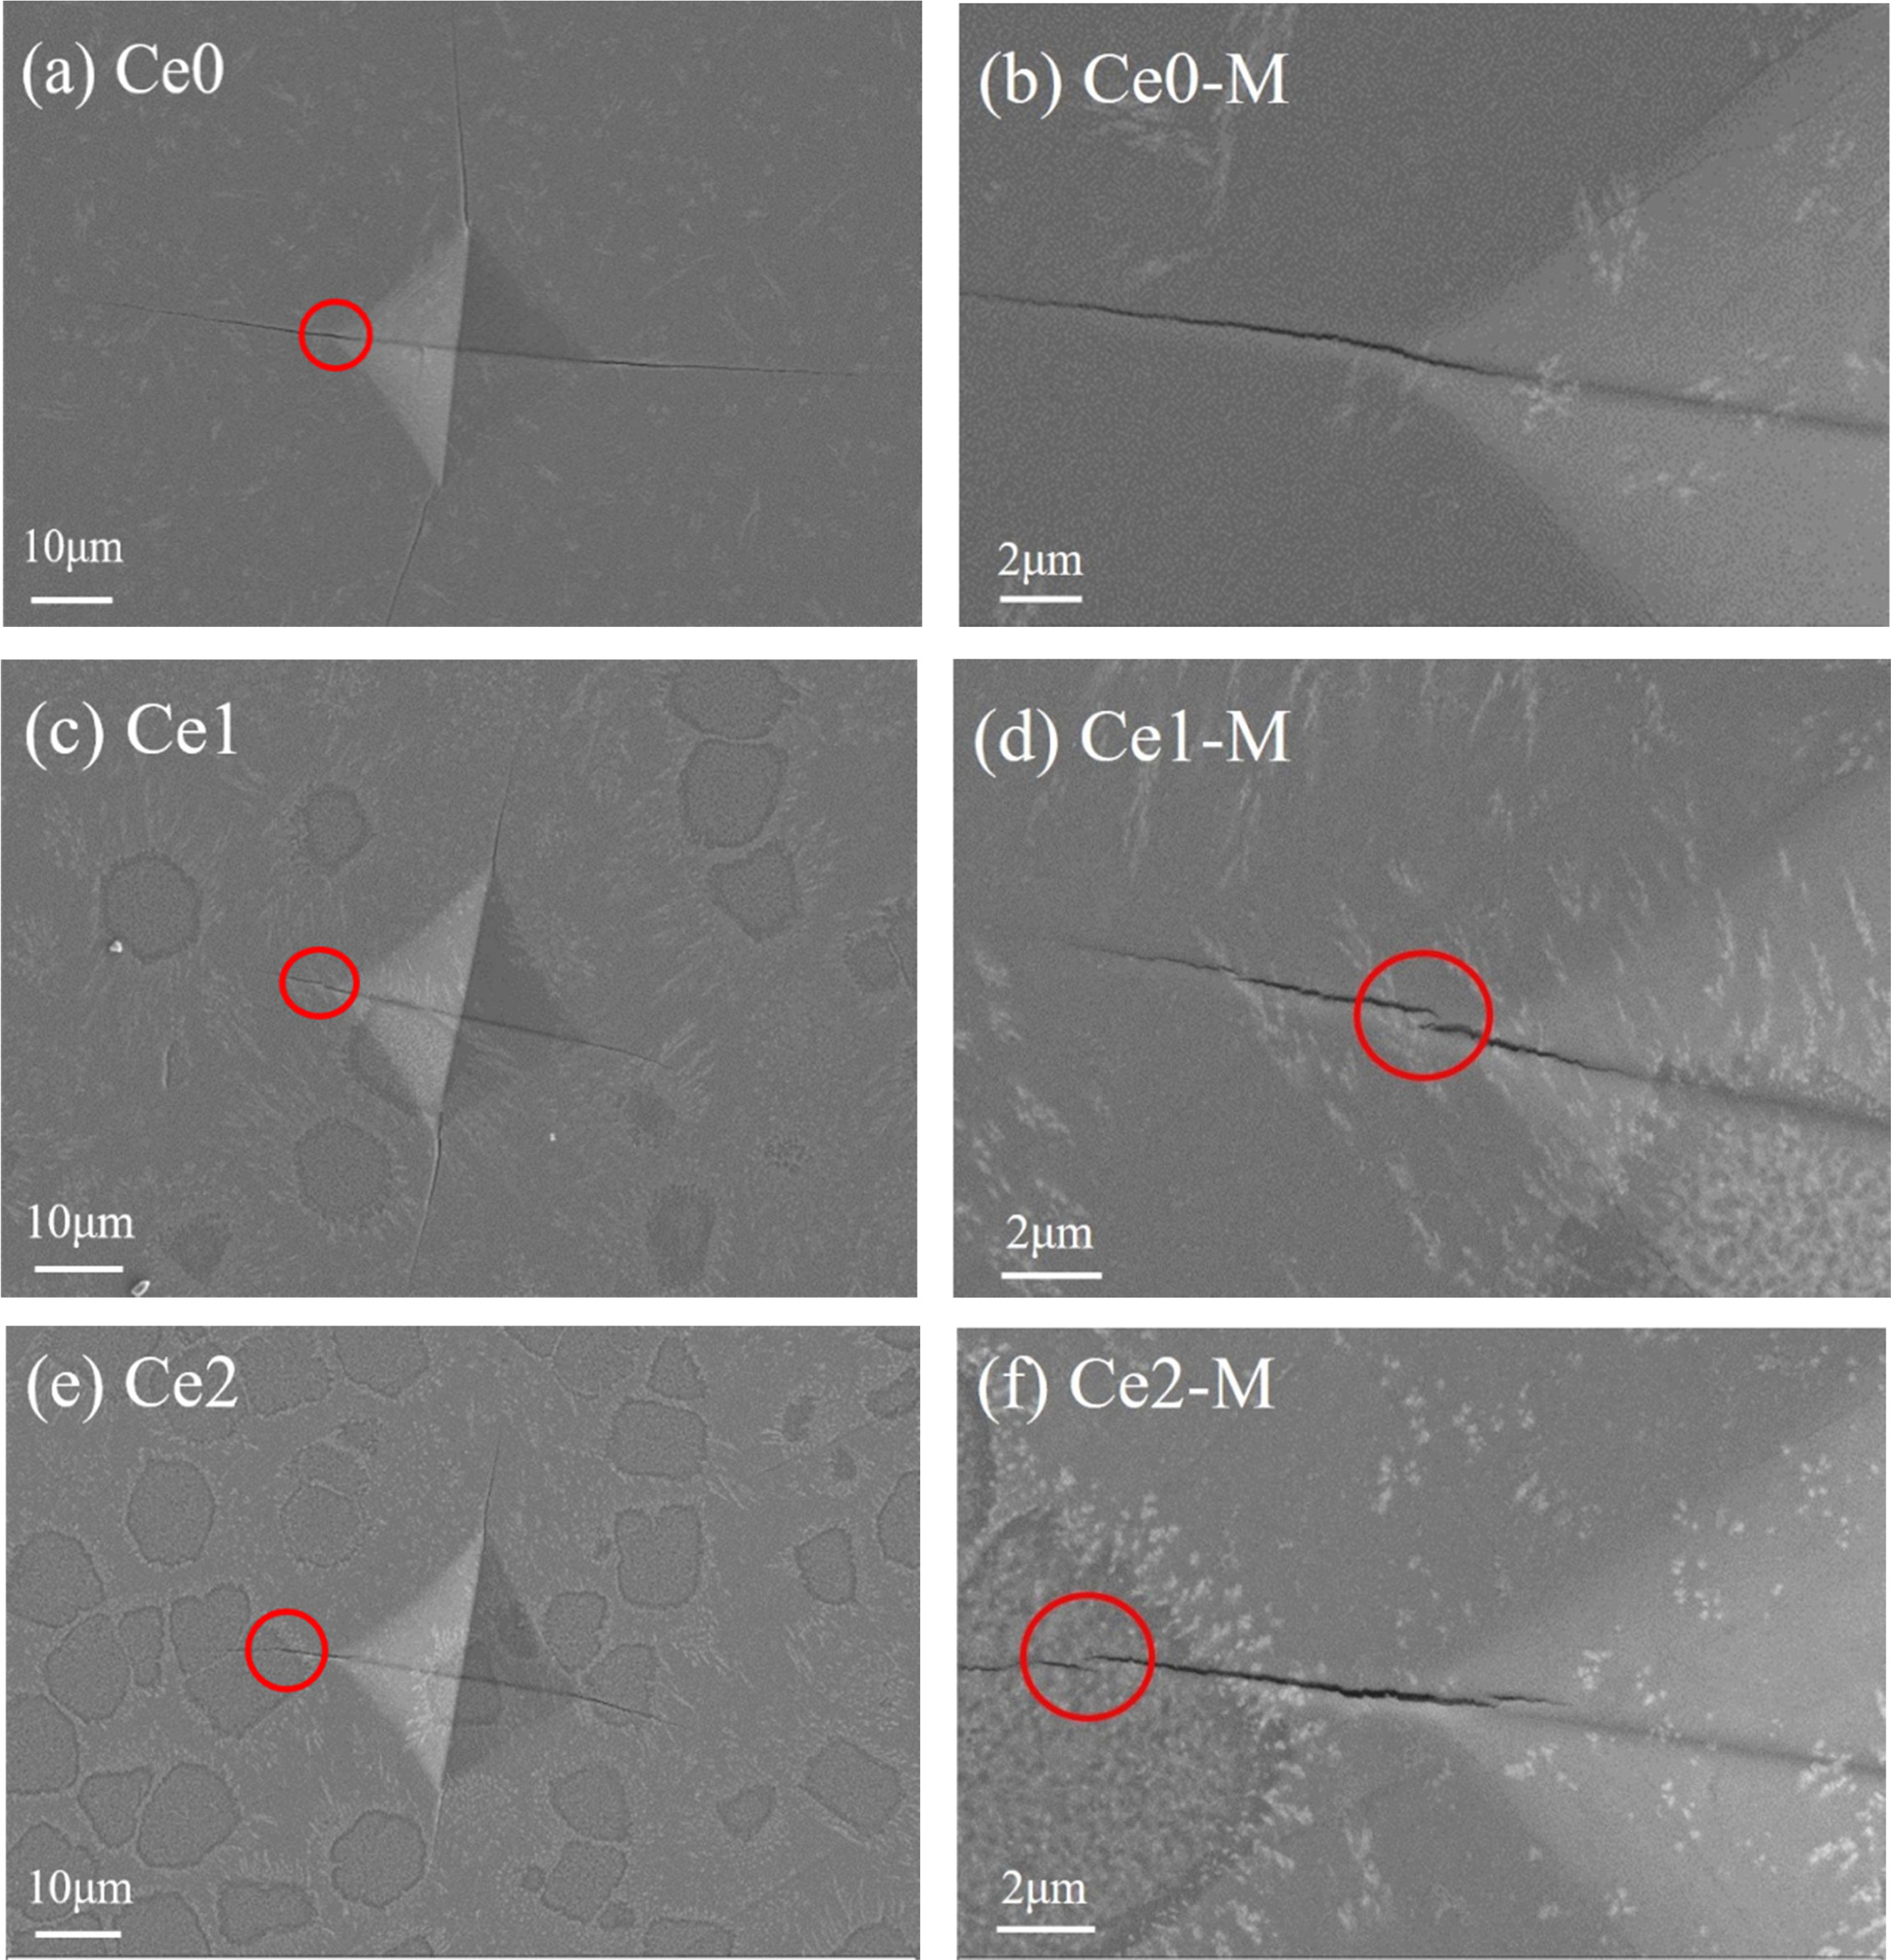
The crack propagation characteristics of glass-ceramics, as an important parameter to characterize fracture toughness, are distinguished by the vivtorinox hardness using the vivtorinox hardness tester. Fig. 5 presents the Vickers impression morphology of glass-ceramics with various CeO2 additions and it can be found that the cracks are formed in the immediate vicinity of the pyramid indent. Furthermore, radial cracks are visible along the diagonal direction of indentations but there are some kinds of differences between crack length and crack propagation mode in glass-ceramics with various CeO2 additions. It can be seen that the crack paths of the four main radial cracks in sample Ce0 are nearly linear and the average crack length measure up to approx. 29.6 μm. No obvious crack deflection or crack bridging are observed as the cracks progress through the material. With the addition of CeO2, the average crack length of samples Ce1 and Ce2 begin to decrease and the phenomenon of crack bridging can be observed. Generally, the crack propagation in glass-ceramics is propagated along the glass phase, and increasing the strength of glass phase contributes to the enhancement of fracture toughness [21-23]. Because of the high electric field characteristics of rare earth ions, the strengthening of glass phase can be achieved by changing the distribution of elements induced by rare earth doping in this experiment. In sample Ce0, a small quantity of rare earth element with cotton-like morphology is evenly distributed in glass-ceramic, and the distribution of elements has not changed significantly due to the low rare earth content of the sample. Images of samples Ce1 and Ce2 show the distributions of elements in glass-ceramics has an obvious change with the addition of CeO2, and some aggregates containing specific elements begin to appear [24]. As a result, the integrity of the glass network structure can be improved. Furthermore, the aggregates with high rare-earth content can be also regarded as a strengthening structural component. Thus, the obvious crack deflection and crack bridging phenomenon can be observed with the addition of CeO2 when cracks pass through glass phases or aggregates, which can resist the crack propagation and improve the toughness of glass-ceramics [25].
|
Fig. 5 Vickers impression morphology of (a), (c), (e) and the corresponding magnified image (b), (d), (f) of glass-ceramics with different CeO2 addition. |
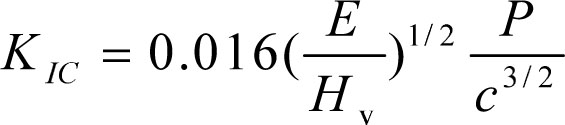
As a quantitative way of measuring resistance to brittle fracture, the fracture toughness is interpreted as the ability of a material to resist fast fracture by crack propagation. In this paper, the fracture toughness parameter (KIC) is determined by application of the Vickers indentation method and the formula is shown below[26]:
 (1)
(1)
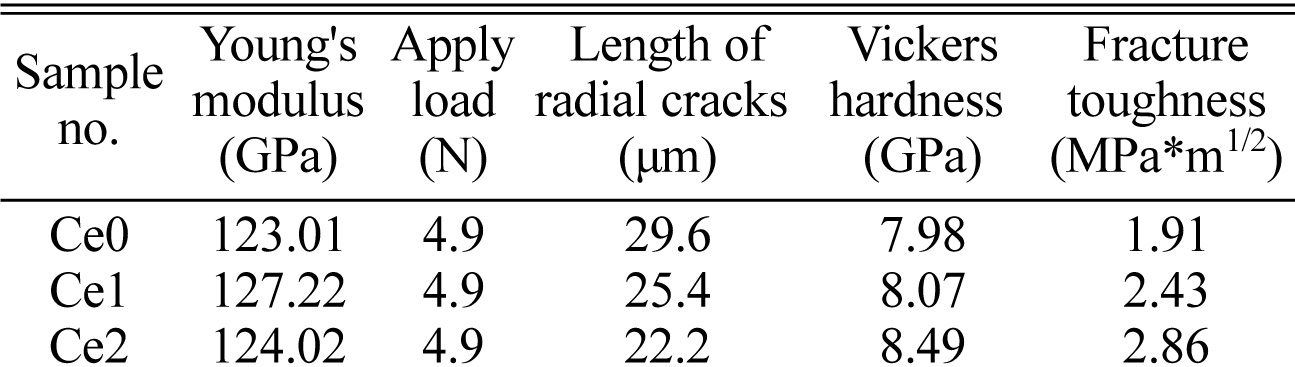
where E is Young’s modulus, Hv is Vickers hardness, P is apply load and c is the length of surface radial cracks. Table 3 gives the relevant parameters for calculating fracture toughness and the calculated values of fracture toughness. The maximum fracture toughness can be obtained for the sample Ce2 and the value show an increase of ~ 50% (2.86 MPa*m1/2) compared with the value of sample Ce0, which may be explained by the decrease of radial crack length. This result suggests that the toughening effect of rare earth is more obvious compared with the method in enhancing fracture toughness of glass-ceramics by controlling crystallization degree [27-30]. In addition, the Vickers hardness increase from 7.98 to 8.49 GPa with increasing CeO2 content and it may be attributed to the strengthening of the glass network structure because of the formation of element aggregate.
|
Table 3 The modulus and fracture toughness of glass-ceramics with different CeO2 addition |
In order to study the mechanism of rare earth-induced evolution of aggregates, the sample Ce2 with different heat treatment stages are prepared and the effect of rare earth on the microstructures and element distribution in glass-ceramics have been investigated. Fig. 6 presents the XRD patterns of sample Ce2 with different heat treatment conditions, where A represents the sample annealed at 600 oC for 2 h, N-0 and N-2 represent the samples nucleated at 720oC for 0 h (soaking time is 0 h when heated to 720 oC) and 2 h (soaking time is 2 h), respectively. The sample N-2 is subsequently crystallized at 850 oC for 0 h (soaking time is 0 h when heated to 850 oC) and the sample number is C-2. It can be found that there is no crystalline phase in the annealed sample, while the main crystal phases of augite appear after nucleation or crystallization treatment. In our previous study, Bayan Obo mine tailing contains a certain amount of symbiotic iron[31]. Iron can be used as an effective nucleation agent to promote the precipitation of the main crystalline phase in the process of heat treatment [32-34].
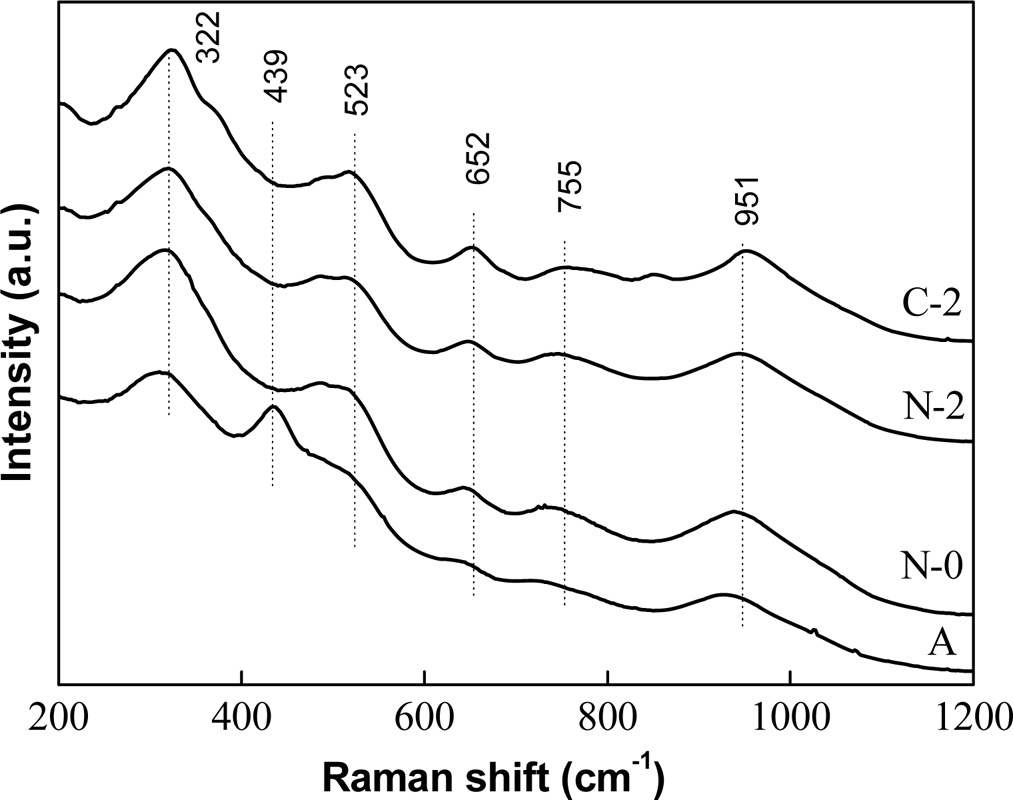
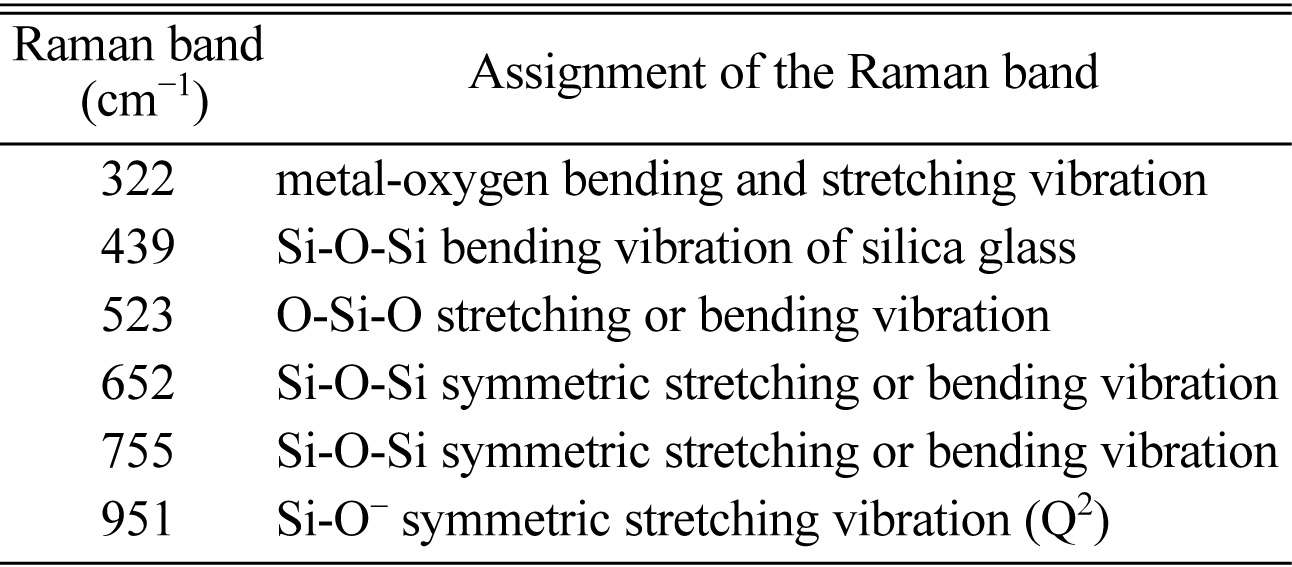
To evaluate the vibration characteristics of chemical bonds in glass-ceramics, Raman spectra of sample Ce2 with different heat treatment stages are investigated and the results are shown in Fig. 7. A summary of all Raman bands is provided in Table 4. The Raman spectra of glass-ceramics can be roughly divided into three regions since the different wave numbers of Raman spectra reflect the structural characteristics of silicate. The peak in low (<400 cm-1), medium (400-800 cm-1) and high (800-1200 cm-1) wavenumber range of the Raman spectra of glass-ceramics correspond to the structural characteristics of silicate in the long range order, middle range order and short range disorder [35]. The peak at 322 cm-1 can be attributed to the metal-oxygen bending or stretching vibration, which reflects the long-range structural order of silicate and appears only in the crystal [36]. It indicates that the degree of crystallization of glass-ceramic is gradually increased with the increasing relative intensity of this peak in the process heat treatment. The peak at 523 cm-1 indicate O–Si–O stretching or bending vibration and the peaks at 652 and 755 cm-1 are attributed to the Si–O–Si symmetric stretching and/or bending vibrations in silicate units with bridging oxygens (BO)[37]. Increasing trend of the above Raman bands are related to the enhanced order and integrity of augite crystal with a chain structure. The peak at 951 cm-1 can be attributed to the Si–O stretching vibration in silicate units with two non-bridging oxygen atoms (NBOs), which can be used to measure the network depolymerization of silicon-oxygen network [38]. The result shows that the depolymerization of the network is mainly determined by the components, and it is not related to the heat treatment stages. In addition, there is a Raman peak at 439 cm-1 in the annealed sample compared with those in other heat treatments and the peak can be attributed to the Si-O-Si bending vibration of silica glass. This phenomenon is attributed to the fact that only annealed sample is amorphous glass according to the XRD analysis.
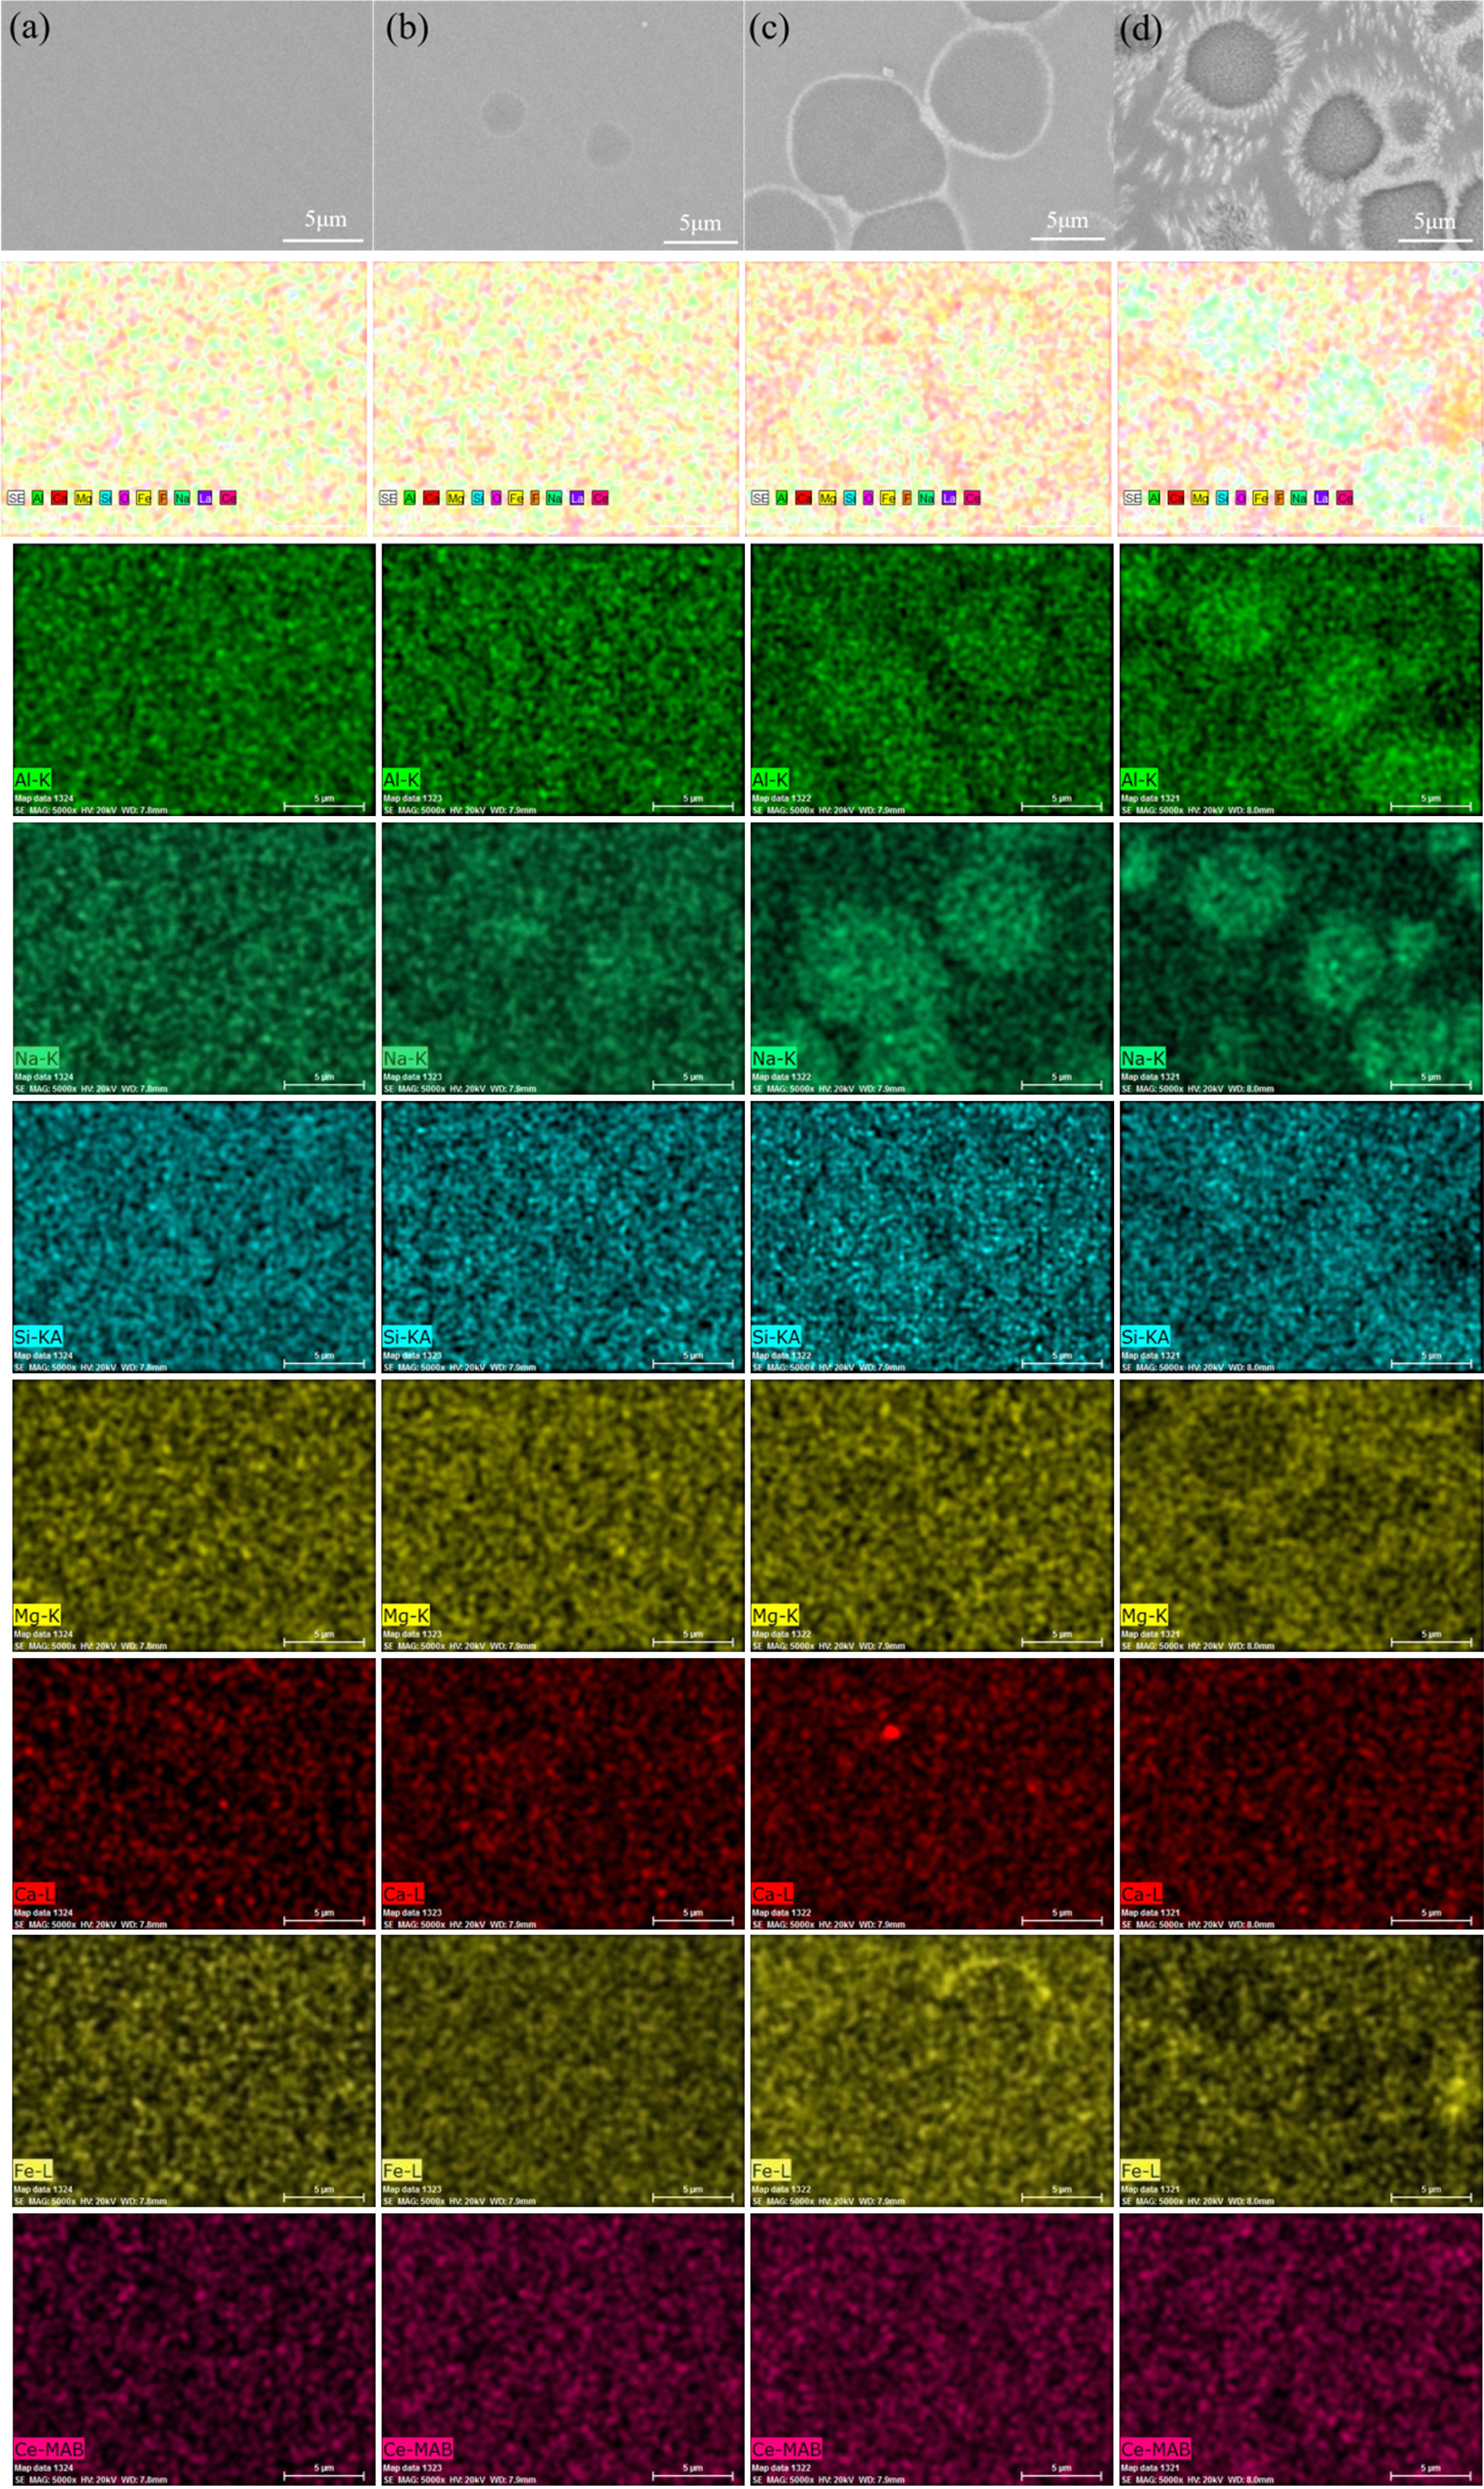
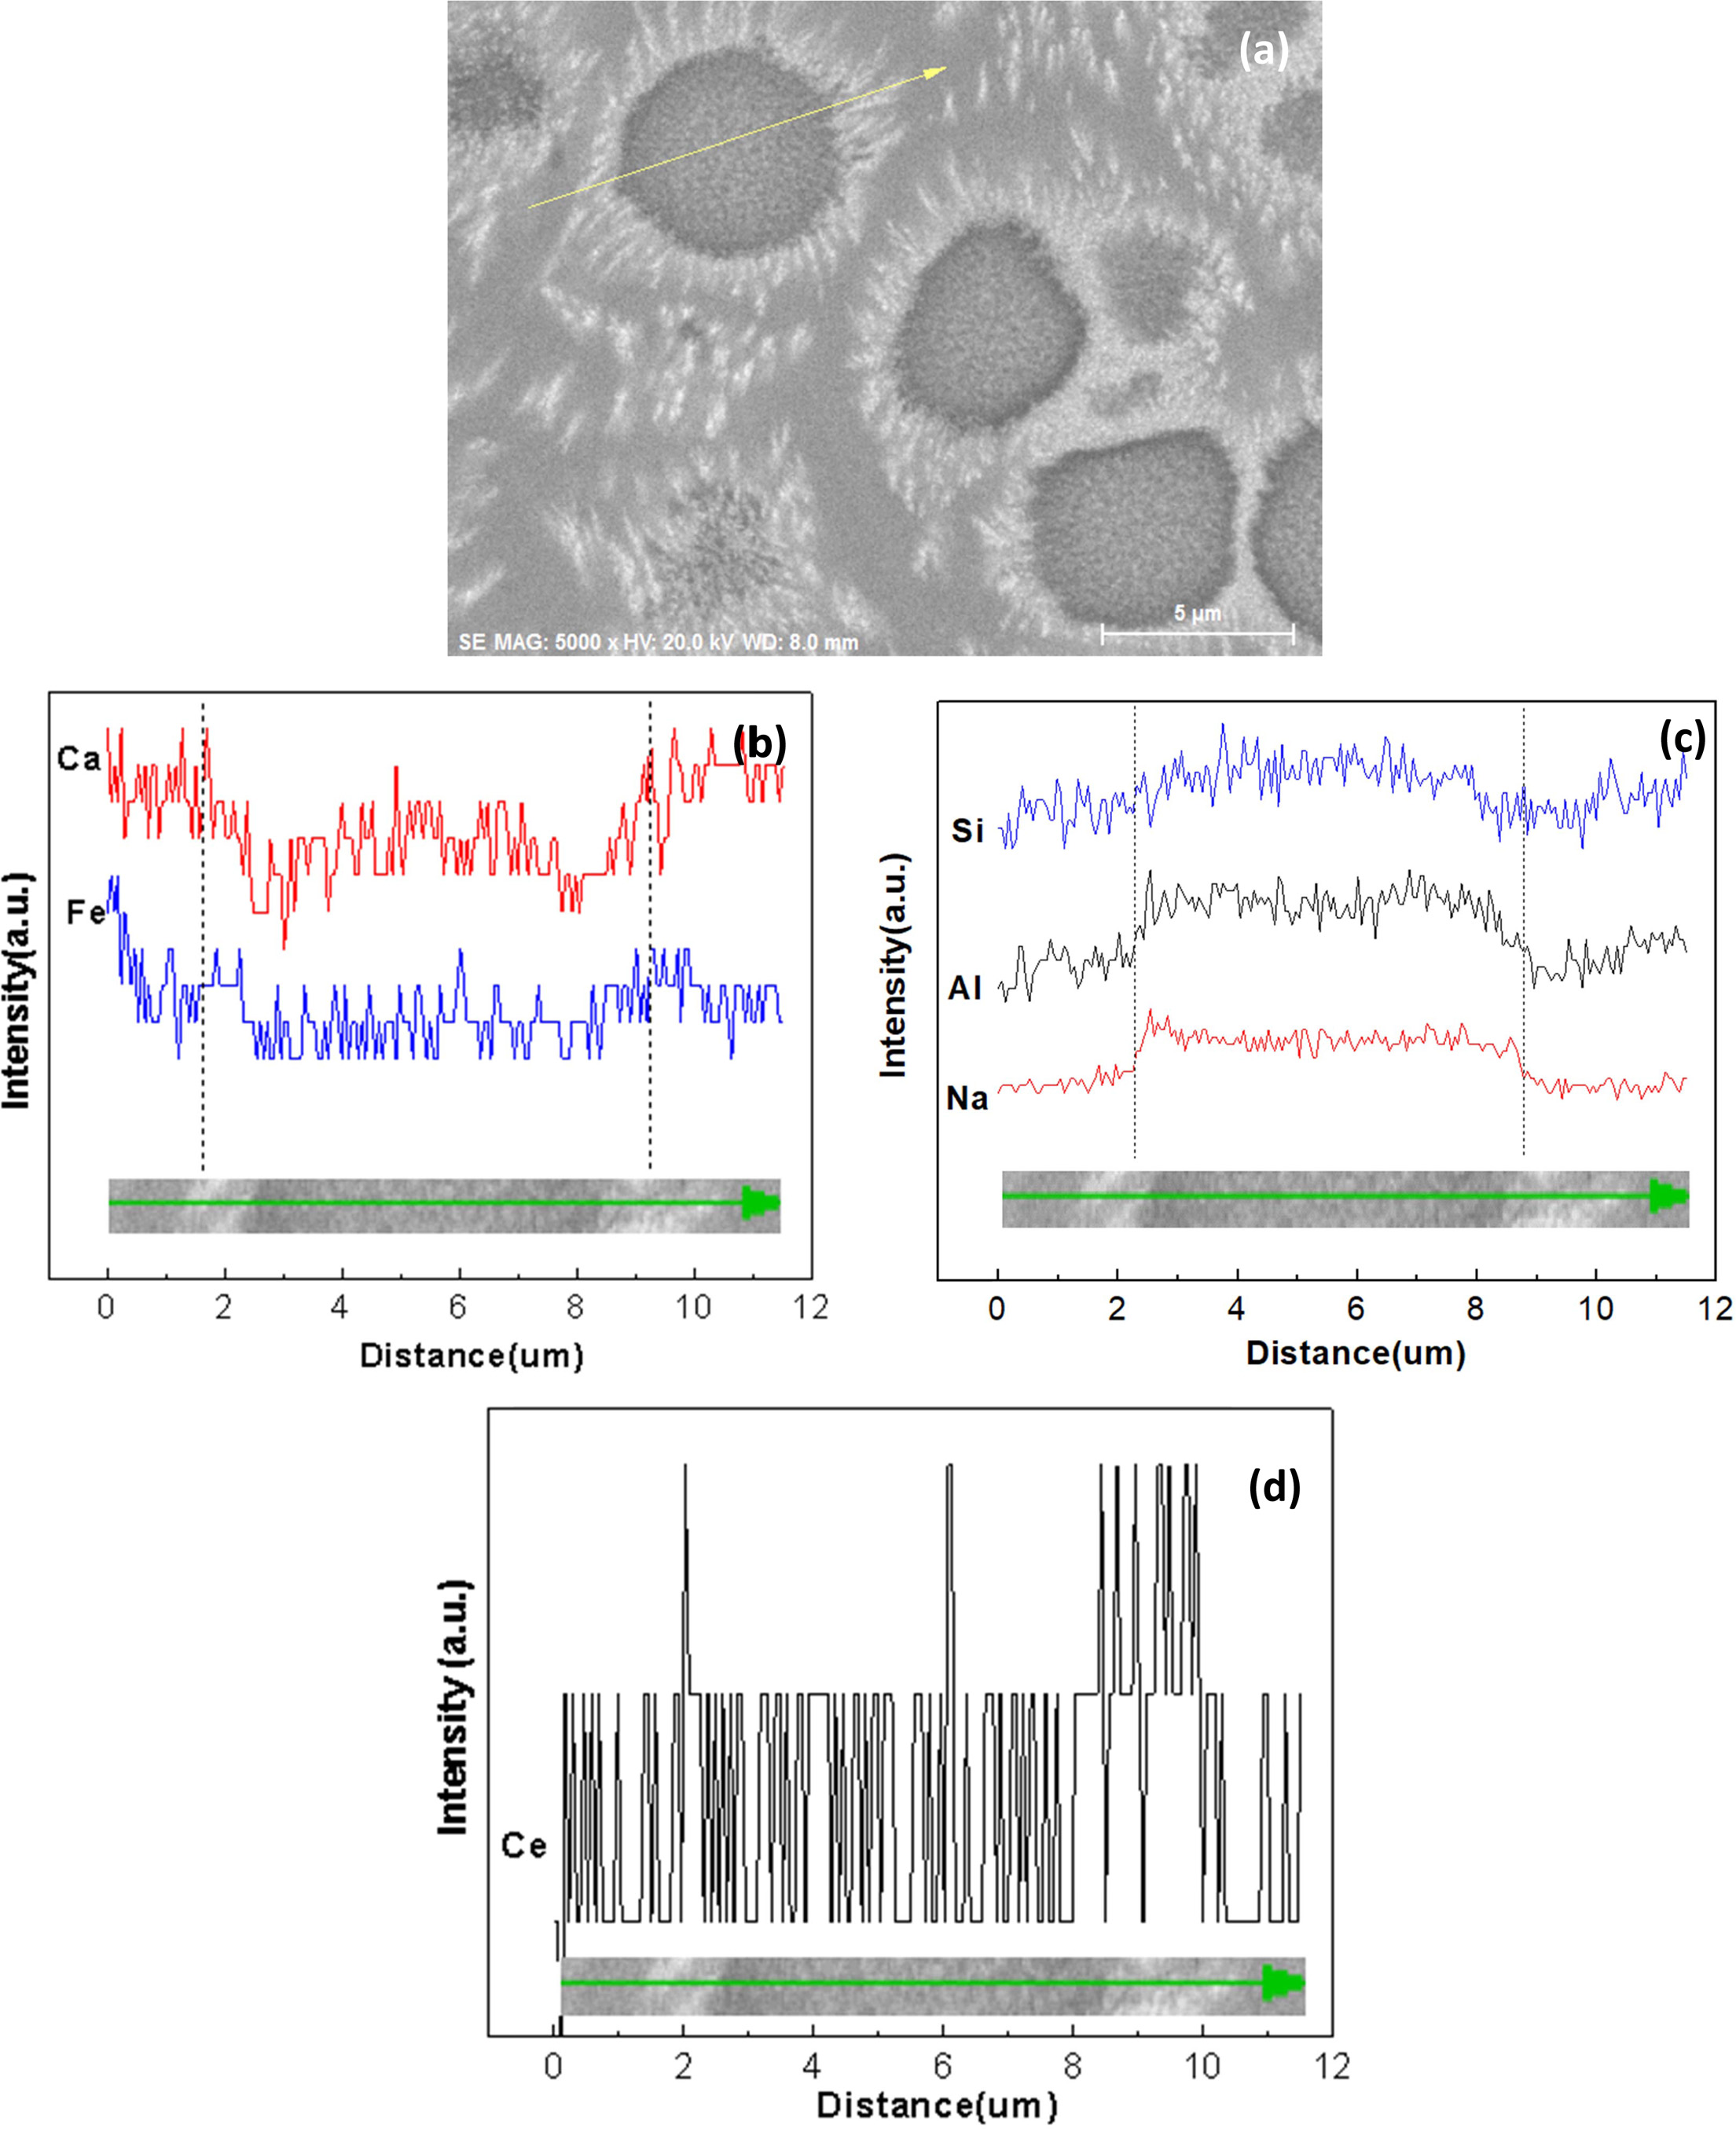
In order to study the distribution of elements in glass-ceramics and the reason of rare earth-induced evolution of aggregates, BSE images and the element-distribution mapping of sample Ce2 with different heat treatment stages are given in Fig. 8. Elemental compositions of sample Ce2 crystallized at 850 oC for 0 h (C-2) is also carried out by X-ray energy-dispersive spectrometry (EDS) analysis operating in line scan mode and the result is shown in Fig. 9. It can be seen that the phenomenon of element aggregates begins to appear as heat treatment proceeds. The aggregates are formed in the early stage of self-nucleation and can be grow up with the heat treatment process, and the final diameter can reach 5-6 µm. There is obvious centralization affection for Si, Al and Na in aggregates, while the content of Fe and Ca is relatively low. Especially, it can be found that the inner and periphery of aggregates is higher in content of rare earth ion than that in other areas through the use of image contrast. The observed phenomenon is mainly due to the high field strength rare earth element of Ce4+ which can gradually drive the elements to form element aggregates during the heat treatment[39]. Generally speaking, Si and Al can be regarded as main glass network forming oxides in glass-ceramic, and the glass network structure may be composed of [SiO4] tetrahedron or [AlO4]- tetrahedron. Here, the negative charge of [AlO4]- can be balanced by Na+. Meanwhile, rare earth ions of Ce4+ can be surrounded by these tetrahedral structures during the heat treatment, which makes a minority of oxide ions involved in RE-O linkages. Thus, the element enrichment of Si, Al, Na and Ce can be observed in the element aggregates. However, due to the fact that the aggregates are mainly found in glass phases, the element of Fe and Ca has a low content since these elements are mainly components of the crystal compositions.
|
Fig. 6 XRD patterns of sample Ce2 with different heat treatment stages. |
|
Fig. 7 Raman spectra of sample Ce2 with different heat treatment stages. |
|
Fig. 8 BSE images and the element-distribution mapping (including Al, Na, Si, Mg, Ca, Fe, Ce) of sample Ce2 with different heat treatment stages. (a) A, (b) N-0, (c) C-0 and (d) C-2. |
|
Fig. 9 EDS analysis operating in line scan mode for sample Ce2 crystallized at 850 oC for 0 h (C-2), (a) the region of scan line, (b)Ca and Fe elemental distribution, (c) Na, Al and Si elemental distribution, (d) Ce elemental distribution. |
|
Table 4 Raman bands observed for sample Ce2 with different heat treatment stages |
The results of this study showed that the main crystalline phase of tailing glass-ceramics can be inhibited to some extent by the addition of CeO2, but the crystalline type and morphology had no obvious change. The high field strength rare earth elements can gradually drive the elements to form element aggregates during the heat treatment, and ultimately affect the properties of glass-ceramics. With the increase in the formation of element aggregates, the densification of glass network can be increased, which can result in the increase in Vickers hardness and decrease in CTE for tailing glass-ceramics. The accumulation of Ce, Al, Na and Si and the absence of Ca and Fe elements can be observed in aggregates. The formation of aggregates can increase crack growth resistance, consume energy in crack propagation process, inhibit crack propagation and ultimately improve fracture performance. The maximum fracture toughness can be obtained for the sample Ce2 and the value increased from 1.91 to 2.86 MPa*m1/2 with increasing CeO2 content.
The authors gratefully acknowledge funding support from the Natural Science Foundation of Inner Mongolia Autonomous Region (Grant no. 2018MS05033, 2017 MS0507) and Major Project of Chinese National Programs for Fundamental Research and Development (973 Program, Grant no.2012CB722802).
- 1. G.A. Khater, Ceram. Int. 37 (2011) 2193-2199.
-

- 2. M. Yang, Z.X. Guo, Y.S. Deng, X.L. Xing, K.H. Qiu, J.P. Long and J.F. Li, Int. J. Miner. Process. 102-103 (2012) 112-115.
-
- 3. Y. Zhao, D.F. Chen, Y.Y. Bi and M.J. Long, Ceram. Int. 38 (2012) 2495-2500.
-
- 4. B.W. Li, L.B. Deng, X.F. Zhang, S.L. Ouyang, Y.S. Du, X.B. Liu and X.L. Jia, Int. J. Appl.Ceram. Technol. 12 (2015) 41-48.
-
- 5. Z.J. Wang, W. Ni, Y. Jia, L.P. Zhu and X.Y. Huang, J. Non-cryst. Solids 356 (2010) 1554-1558.
-
- 6. B.W. Li, H.X. Li, X.F. Zhang, X.L.Jia and Z.C. Sun, Int. J. Min. Met. Mater. 22 (2015) 1342-1349.
-
- 7. F. Ye, L.M. Liu and L.J. Huang, Compos. Sci. Technol. 68(2008) 1710-1717.
-
- 8. A. Mukhopadhyay, B.T.T. Chu, M.L.H. Green and R.I. Todd, Acta Mater. 58(2010) 2685-2697.
-
- 9. H.C. Li, D.G. Wang, X.G. Meng and C.Z. Chen, Biointerphases 9 (2014) 1014-1020.
-
- 10. M. Garai and B. Karmakar, J.Alloys Compd. 678(2016) 360-369.
-
- 11. H. Abdoli, P. Alizadeh, D. Boccaccini and K. Agersted, Mater. Lett. 115 (2014) 75-78.
-
- 12. H.X. Zhang, Y.S. Du, X.W. Yang, X.F. Zhang, M. Zhao, H. Chen, S.L.Ouyang and B.W. Li, J. Non-cryst. Solids 482 (2018)105-115.
-
- 13. A. Hruby, Czech. J. Phys. B 22 (1972) 1187.
-
- 14. K. Yang, J.R. Liu, B. Shen, J.W. Zhai and H.T. Wang, Mater. Sci. Eng., B 223 (2017) 178-184.
-
- 15. J Brus, L Kobera, M Urbanova, D Kolousek and J Kotek, J. Phys. Chem. C 116 (2012) 14627-14637.
-
- 16. C Russel and A Wiedenroth, Chem. Geol. 213 (2004) 125-135.
-
- 17. B.W. Li, Y.S. Du, X.F. Zhang, M. Zhao and H. Chen, Environ. Prog. Sustain. Energy 34 (2015) 420-426.
- 18. H. Abdoli1, P. Alizadeh1 and K. Agersted, Ceram. Int. 40 (2014) 7545-7554.
-
- 19. Z.Li, J.F.Wu, L.Song and Y.Q.Huang, J. Eur. Ceram. Soc. 34 (2014) 3981-3991.
-
- 20. N. Sasmal, M. Garai and B. Karmakar, J. Asian Ceram. Soc. 4 (2016) 29-38.
-
- 21. F.C. Serbena, V.O. Soares, O. Peitl, H. Pinto, R. Muccillo and E.D. Zanotto, J. Am. Ceram. Soc. 94 (2011) 1206-1214.
-
- 22. E. Ercenk and S. Yilmaz, J. Ceram. Process. Res. 16 (2015) 169-175.
- 23. E. Apel, J. Deubener, A. Bernard, M. Höland, R. Müller, H. Kappert, V. Rheinberger and W. Höland, J. Mech. Behav. Biomed. Mater. 1(2008) 313-325.
-
- 24. J. Wang, C. Liu, G.K. Zhang, J. Xie, J.J. Han and X.J. Zhao, J. Non-cryst. Solids 419 (2015) 1-5.
-
- 25. G.H. Beall, Int. J. Appl. Glass Sci. 5 (2014) 93-103.
-
- 26. F.C. Serbena, I. Mathias, C.E. Foerster and E.D. Zanotto, Acta Mater. 86 (2015) 216-228.
-
- 27. Y.J. Park and J. Heo, Ceram. Int.28 (2002) 689-694.
-
- 28. A.S. Demirkiran, S. Yilmaz and U. Sen, J. Ceram. Process. Res. 14 (2013) 51-55.
- 29. A. Hu, M. Li and D. Mao, Mater. Charact. 60 (2009) 1529-1533.
-
- 30. Y.S. Du, X.W. Yang, H.X. Zhang, X.F. Zhang, M. Zhao, H. Chen, S.L. Ouyang and B.W. Li, J. Ceram. Process. Res. 17 (2016) 1243-1248.
- 31. B.W. Li, Y.S. Du, X.F. Zhang, X.L. Jia, M. Zhang and H. Chen, Trans. Indian Ceram. Soc. 72 (2013) 119-123.
- 32. J. Li, C.L. Zhang, L.Y. Xu, X.T. Yin and Q. Zhou, J. Nanoelectron. Optoelectron. 14 (2019) 408-412.
-
- 33. B. Li, Y.Y. Wang, W.Q. Luo and Y.H. Zhang, J. Radioanal. Nucl. Chem. 314 (2017) 1619-1625.
-
- 34. E. Mohaghegh, A. Nemati, B.E. Yekta, S. Banijamali and F. Rezaei, J. Non-Cryst. Solids 408 (2015) 130-136.
-
- 35. E. Huang, C.H. Chen, T. Huang, E.H. Lin and J.A. Xu, Am. Mineral. 85(2000) 473-479.
-
- 36. B.W. Li, L.B. Deng, X.F. Zhang and X.L. Jia, J. Non-cryst. Solids 380 (2013) 103-108.
-
- 37. H.X. Li, B.W. Li, L.B. Deng, P.F. Xu, Y.S. Du and S.L. Ouyang, J. Eur.Ceram. Soc. 38 (2018) 2632-2638.
-
- 38. D.U. Tulyaganov, S. Agathopoulos, J.M. Ventura, M.A. Karakassides, O. Fabrichnaya and J.M.F. Ferreira, J. Eur.Ceram. Soc. 26 (2006) 1463-1471.
-
- 39. W.H. Zheng, J.S. Cheng, L.Y. Tang, J. Quan and X. Cao, Thermochim. Acta 456 (2007) 69-74.
-
 This Article
-
2019; 20(4): 401-410
Published on Aug 31, 2019
- Received on Apr 8, 2019
- Revised on Jul 22, 2019
- Accepted on Jul 24, 2019
Services
- Abstract
introduction
experimental procedure
results and discussion
conclusions
acknowledgments
- References
- Full Text PDF
Shared
Correspondence to
- Baowei Li
-
Key Laboratory of Integrated Exploitation of Bayan Obo Multi-Metallic Resources, Inner Mongolia University of Science and Technology, Baotou 014010, China
Tel : +86-472-5954358
Fax: +86-472-5954358 - E-mail: dys1111@imust.cn
Clean-Energy Research Institute(CRI), Hanyang University, 222, Wangsimni-ro, Seongdong-gu, Seoul, 04763, Korea
E-mail: jcpr@hanyang.ac.kr