


- Processing of high conductive Bi2O3/8YSZ composites as SOFC electrolyte
Li-Der Liu, Yu-Hung Cheng and Wen-Chen J. Wei*
Dept. Mat. Sci. Eng., National Taiwan University, Taipei, Taiwan 106, ROC
Dual-phasic composites consisted of continuous Bi2O3 matrix and 8 mol% yttria stabilized zirconia particulates were prepared by solid-state-sintering or liquid-phase-sintering, and investigated over the temperature range between 250-650 ℃ to reveal good electrical conductivity and matched thermal expansion to the components used for intermediate-temperature solid oxide fuel cell (SOFC). Interface reactions occurred during sintering either at 750 ℃ or 900 ℃ could enhance the diffusion of Zr, Y and Bi ions, to form effective diffusion zone for stabilizing δ-Bi2O3 matrix. The results showed a dual-structure of 66 mol% 8YSZ-34 m% Bi2O3 with up to 76% δ-phase content was stabilized by solid-state sintering, surpassing a bulk conductivity of 10-2 Scm-1 at 500 ℃. The coefficient of thermal expansion value exhibited by the composite between 25 ℃ and 650 ℃ was found to be 10-12.2 ppm*K-1, which was in good agreement with that of CeO2-based electrolyte. Thus, it was confirmed that the addition of ZrO2 could stabilize the Bi2O3, by improving its capability as a solid electrolyte for intermediate temperature SOFC.
Keywords: Bismuth oxide; zirconia; composite; interface; ionic conductivity
Generally, 8 mol% yttria-stabilized zirconia (8YSZ) has been widely used as an oxygen ion conductor in oxygen sensors and solid oxide fuel cells due to its good electrical conductivity, thermal stability, and chemical stability at high temperature. Nevertheless, the electrical conductivity of this type of material either at intermediate temperatures or even at low temperatures needs to be improved.
The other electrolyte with a highly oxygen-ionic conductivity for solid oxide fuel cells (SOFCs) operating at temperatures below than 600 ℃ was one of main interests in the past decade. δ-Bi2O3 was known for its exceptional ability to transport oxygen ions [1], which could enhance the conductivity of a cubic fluorite structure to three orders of magnitude higher than that of 8 mol% yttria stabilized zirconia (8YSZ) and doped ceria at temperatures below 800 ℃. However, the Bi2O3-based electrolytes could be possibly reduced at low oxygen partial pressures, especially in H2 rich atmosphere. At 600℃, Bi2O3 could become unstable in the atmosphere of an oxygen partial pressure below 10-8-10-9 Pa [2]. These were the limiting factors for the utilization of Bi2O3.
Wachsman et al. [3, 4] have demonstrated the bilayer concept using an additional Sm-Doped Ce or Gd-Doped CeO2 (GDC) thin film on the anode side of the Bi2O3 electrolyte. The results showed the effective prevention of the direct contact of the Bi2O3 to the reducing atmosphere. Similar work was also reported by Fung et al. [5] using YSZ to block the gaseous species, such as H2 or CO. But their additional YSZ or GDC barrier layer would contribute to electrolyte resistance as a result of increased electrolyte thickness. Thus, designing of alternative materials must be considered.
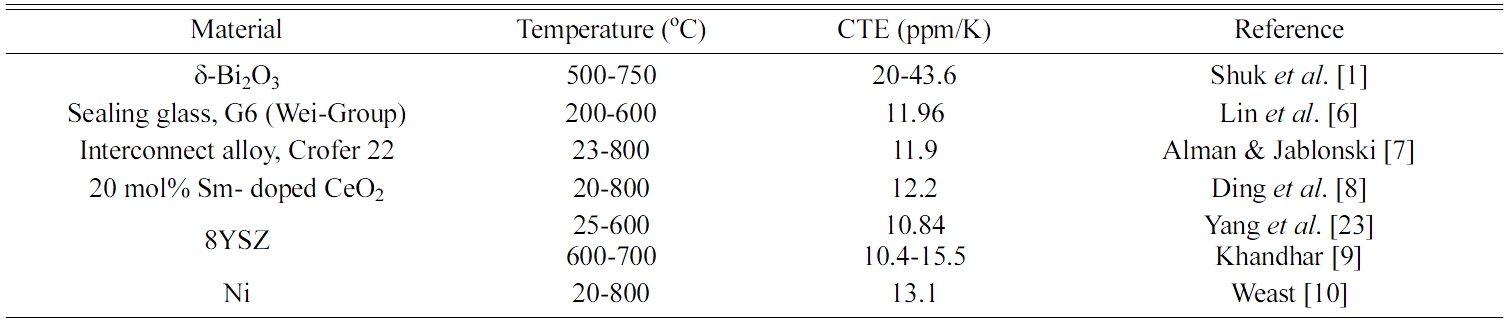
Another important issue was whether the thermal expansion compatibility of a Bi2O3 electrolyte could be comparable with the other cell components or not. Table 1 shows a list of coefficient of thermal expansion (CTE) of common components of SOFCs and possible interconnect [6-10], which were possibly subjected to complex thermal stresses during start-up and cycling conditions of cells. These components showed the CTE values between 10.9 ppmK-1 of 8YSZ and 13.1 ppmK-1 of pure Ni. Between the intermediate operating temperatures of SOFC, i.e. 500 ℃ - 800 ℃, the CTE values of the stabilized δ-Bi2O3 was reported as ranging from 20 ppmK-1 to 43.6 ppm*K-1 [1], which were far beyond the structural tolerance of the cells either in planar or tubular design.
The other concern is the electric conductivity of (Bi1-x,Mx)2O3 materials, where M is an aliovalent ion. The conductivity of Bi2O3-based materials was found to be highly dependent on the crystalline structure and amount of M-oxide in solid solution. Several Bi2O3-MOx phase diagrams, (e.g. Bi-Nd-oxide phase diagram) have been reported suggesting that the Bi2O3 could have a low melting point (825 ℃) and thus tend to undergo the complex phase transformation from δ- to β-phase, or to other low-conductive phases upon cooling from 700 ℃ to room temperature. A least solid-solution level of MOx for stabilizing the highly conductive, cubic δ-phase at room temperature was reported to be 15 mol% of Nb2O5 [11], 20 mol% Y2O3 and rare earth oxide [5, 12], and 11-30 mol% other oxides [1, 13]. The more the solid solution, the lower the conductivity of the doped δ-phase is.
Bi2O3 has been used as a sintering aid in the densification of 8YSZ electrolyte primarily due to its low melting temperature and good wetting to YSZ materials. Several researchers were able to obtain appreciable bulk density at low sintering temperatures (below 1400 ℃) by increasing the content from 1 mol% to 5 mol% of Bi2O3 in YSZ [14-16]. The densification of the compacts was suggested to be dominated by liquid phase sintering (LPS) mechanism. However, in Kim’s dissertation [17],1) sintering 8YSZ with less than 4.5 mol% Bi2O3 resulted into rather a different mechanism from conventional liquid phase sintering, because of the significant diffusion of Bi2O3 into 8YSZ during sintering, Besides, precipitation of the monoclinic ZrO2 platelets was also observed when the system was sintered at liquid-phase temperatures due to the dissolution of the ZrO2 in liquid Bi2O3 [17, 18].
Bi2O3-8 mol% V2O5 materials with a dual-phase microstructure has been reported by Lai et al. [19]. In their study, the authors used very long-holding time to create one continuous γ-phase matrix and dispersed 6:1-phase. This present study is performed in consideration of a high ionic conductor used for the electrolyte of SOFC with a plan to obtain a designed duel-phase composite as described below:
1. A continuous least-doped δ-Bi2O3 matrix which could be stabilized between IT to room temperature that could show a good electric conductivity;
2. Good boundary matching between the two phases without apparent interface reactions;
3. Acceptable CTE matching with that of either 8YSZ or doped CeO2.
In this study optimizing parameters were also proposed. One of the higher melting temperature fluorite materials, such as. 8YSZ particles, were used as additive phase with desired selection. Furthermore, an alternative to solid-state sintering approach was considered to prevent apparent liquid/solid reaction. The obtained dual-phasic composites in this study were also compared with those materials densified just above the melting point (825 ℃) of Bi2O3 under a minimized melting period to reduce the extent of the interfacial reactions in the presence of liquid phase.
The scope of present study is to obtain the composites with higher (>50 wt%) Bi2O3 contents, particularly from 34.4 to 82.6 mol% (equivalent to 50 wt% to 90 wt%) and also to compare the data obtained. in Kim’s [17] and Joh’s [15] works. The composites obtained in this study are expected to reduce the CTE to an appreciable value, and to provide high amount of δ-phase Bi2O3 as fast ionic-conduction pathways. Precise measurements on microstructural and electric properties were also carried out to support the potential applications of this composite as the electrolyte of SOFC. Thus, the highlight of this study was to investigate the influence of Bi2O3 on the polymorphic phases and ionic conductivity of YSZ and also to report the ability of bismuth oxide doping for reducing sintering temperature of electrolyte as well as increasing the density and ionic conductivity.
|
Table 1 Thermal expansion coefficients (CTE) of common SOFC cell component materials. |
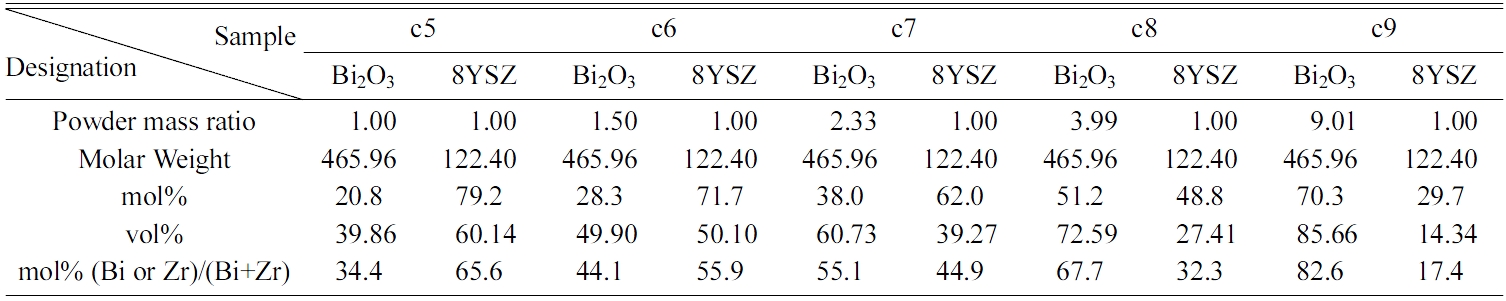
Reagent grade 8YSZ (TZ-8Y, Tosoh Co., Japan) and Bi2O3 powder (99.9% pure, Solar Technology Co., Taiwan) were separately dispersed in de-ionized water with 1 wt% of D-134 dispersant (Dai-Ichi Kogyo Seiyaku Co., Japan) and ball-milled for 24 h with 5 mm zirconia milling media in PE bottles to ensure the well-dispersion of the slurries. Stoichiometric amount of 8YSZ slurry was then added into the Bi2O3 slurry, with milling for another 24 h. The compositions of each composite are shown in Table 2 and designated as c5, c6, c7, c8, and c9 with respect to 50 wt%, 60 wt%, 70 wt%, 80 wt%, and 90 wt% Bi2O3 contents in the samples, respectively. This could correspond to a compositional range of 20.8 mol% to 70.3 mol% Bi2O3.
The mixed slurries were dried at 75 ℃ with an Eyela rotary vacuum evaporator, then ground, sieved, and separately die-pressed at 25 MPa with a WC mold into disks with a diameter of 5.0 mm and a thickness of 1.0 mm. Each green disk was then directly sintered at two different thermal schedules A and C, as shown in Table 3. Thermal schedule A was a LPS treatment at 900 ℃ for just 1 min followed by immediate furnace cooling down to 750 ℃, and then slowly cooled in furnace, then to room temperature. The C schedule was sintering in solid state at 750 ℃ for 1 h.
|
Table 3 Furnace setting parameters for thermal schedules A and C. |
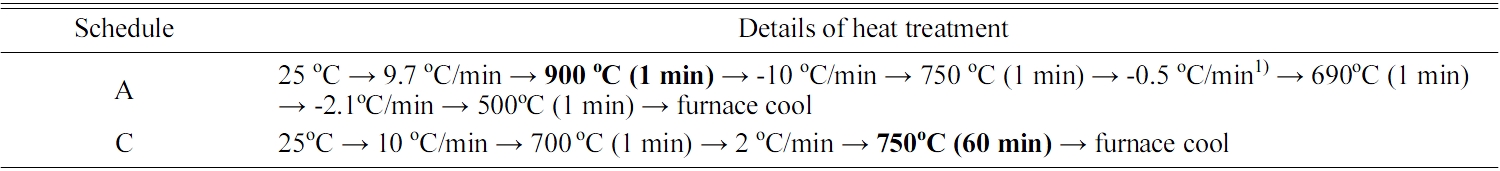
1) The slow cooling is selected to ease the phase transformation of δ- to β-Bi2O3. |
Microstructure was studied by using a scanning electron microscope (SEM, JSM 6510, JEOL Co., Japan or LEO Instrument field-emission gun SEM, the Netherland). Cross sectional SEM+EDS images were obtained on fractured surfaces of the sintered samples. The image mode was collected in back scattered electron (BSE) signals to reveal the contrast of the features distributed in dense matrix.
Crystal phases were analyzed by a PANalytical X-ray diffractometer (XRD, PHILIPS X’Pert Pro. Co., USA). The incident beam was Cu Ka characteristic X-ray at 45 kV and 40 mA. The X-ray intensity was collected from 20o-80o 2θ angle. Phases were quantified with reflex module in material studio 5.0 based on integrated intensities of the selected phases found in the range of 31-34o 2θ angle. The standard intensity positions of pure phase δ-Bi2O3 and β-Bi2O3, (2 0 0)δ, (0 0 2)β and (2 2 0)β reflections, were obtained and used as references for simulating the XRD patterns from the JCPDS crystal structures.
A few selected composite samples have been prepared into thin TEM foils with focused ion beam (FIB) method. A layer (> 1 μm) of protective carbon or Pt (depending on machine) was initially deposited on top of the specimen. Two symmetrical trenches were cut with a regular cut mode by Ga-ion beam in a current of 9.3 nA at accelerating voltage of 30 kV (with a planar dimension in an aspect ratio of y = 2z), followed by cleaning with incrementally reduced beam current down to 28 pA. The cutting area was finally polished and controlled at roughly 30-50% of total viewing area. The specimen was studied with an analytical transmission electron microscope (JEM-2100F, JEOL Co., Japan).
One composite with 50 wt% pure ZrO2, denoted as z5 were also prepared by schedule A for comparison. In addition, two diffusion couples each with pre-sintered bulks of 8YSZ and Bi2O3 were also thermal-treated by the schedules A and C. Line scans and composition of each element on the cross section of the coupled specimens were obtained from the energy dispersive X-ray spectroscopy (EDS) equipped on the TEM.
A homogeneous, fully stabilized δ-phase sample (DW sample) in a reported composition of (Dy2O3)0.15(WO3)0.05(Bi2O3)0.8 (as named “DW15-5”) [20] was also prepared as a comparative material with doped δ-Bi2O3. The DW sample was used as received with high purity (> 99%). Dy2O3, WO3 and Bi2O3, which were separately dispersed in de-ionized water with 1 wt% of D-134 dispersant (Dai-Ichi Kogyo Seiyaku Co., Japan), and separately ball-milled for 24 h to ensure well-dispersed slurries. Individual slurries were then mixed in stoichiometric amounts for additional 24 h of similar ball-mill mixing before drying in an Eyela rotary vacuum evaporator. Dried powder mixture was then similarly die-pressed followed by calcination and sintering procedures described by Jiang et al. [20].
The conductivities of the sample disks were measured with an Electrochemical Workstation (Zahner Elektrik IM6 and Gamry 3000, Germany) using a two-electrode method from 250 ℃ to 650 ℃ in a 50 ℃ increment. Thin Pt electrodes of 5.00 mm diameter were physically sputtered at 30 mA for 60 s on both sides of the disks. The electrodes were attached to Ag wires of 0.2 mm diameter fixed with Ag conductive paste on either sides of the sample. Each measurement was equilibrated at each temperature for at least 20 min before the data was recorded. DC conductivity measurements were obtained averaging by 5 resistance values, which were collecting the current readings from 0.1 V to 0.5 V. The conductivity was calculated as below.
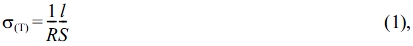
where S is the electrode contact area, l is the thickness of the sample, R is the average measured resistance. As the σ(T) plotted against inverse temperature, an activation energy (Ea) can be obtained by interpolating the slope of the log(σT)-1/T curve from the relation:
where K is a constant.
Thermo-mechanical analysis (TMA) was performed on a TA Instrument (Q400EM, DE, US) with a temperature and dimensional precision of 1 ℃ and ±0.1%, respectively. Representative bulk sintered disks were placed directly under probe and measured up to a temperature of 800 ℃ at a rate of 10 ℃ min-1 in air atmosphere.
Both Bi2O3 and ZrO2 showed same fluorite structure at high temperatures. Upon cooling, the cubic δ-Bi2O3 could undergo a transition through metastable tetragonal β-structure, then to a stable monoclinic α-structure. The transformation was controlled by the type and quantity of the dopant. The ionic radii of three cations obtained in this study was arranged in an order of Zr4+ < Y3+ < Bi3+. Thus, 8 mol% Y2O3 stabilized cubic ZrO2 (8YSZ) could undergo a lattice expansion with Y doping, while a cubic yttria doped Bi2O3 experienced the opposite trend, leading to the formation of Bi3YO6 (a Type II compound).
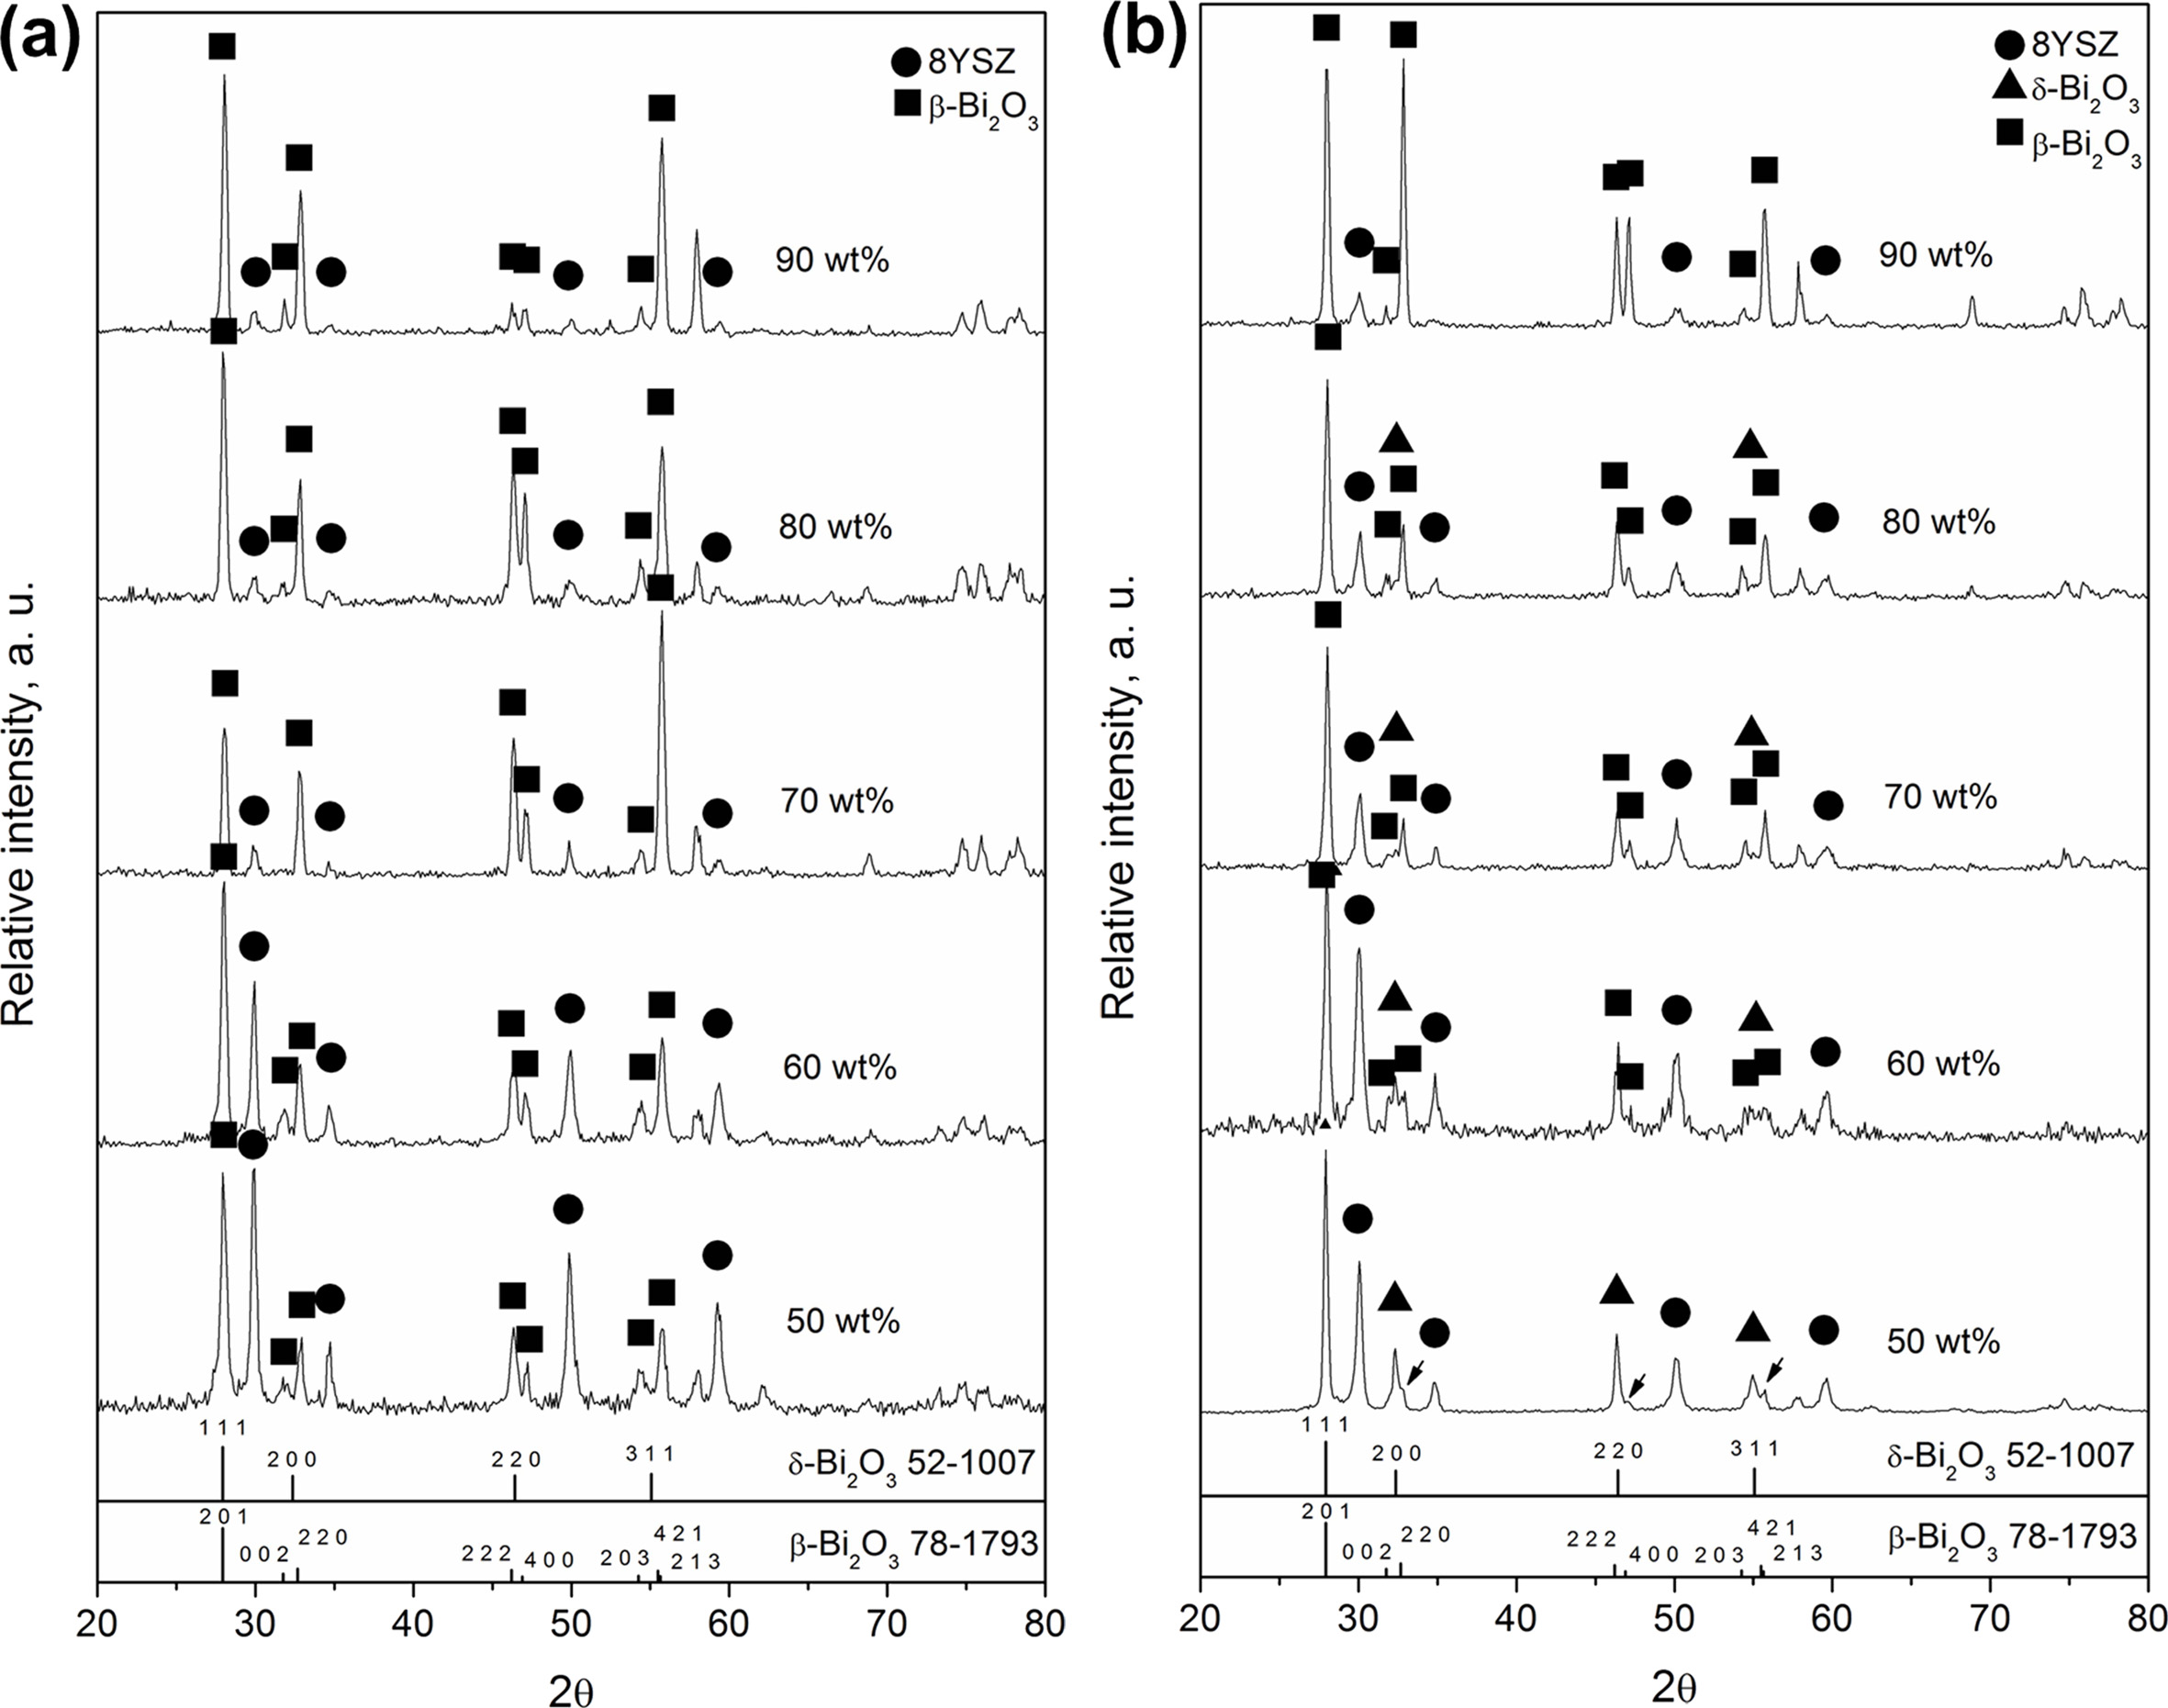
By sintering pure Bi2O3 as a matrix with stabilized 8YSZ particulates, a variety of phases was observed as shown in Fig. 1(a), of which the XRD spectra of the composites sintered by the schedule A showed mainly two-phase structures: due to cubic YSZ and tetragonal β-phase Bi2O3 solid solution. The δ-phase Bi2O3 solid solution (denoted as δ-BiYO in this study) was not clearly identified. Moreover, the cubic-YSZ showed a decreasing trend of the intensity towards higher Bi2O3 contents. At 50 wt% Bi2O3, the intensities of both cubic YSZ and β-BYO were equally strong. As the Bi2O3 content increased greater than 70 wt%, the intensities of 8YSZ became considerably weaker and the obvious peak fading was observed.
The samples sintered at schedule C (at 750 ℃ for 1 h), did not only show 8YSZ and β-BYO peaks, but also showed several appreciable reflections of δ-Bi2O3 phase, as shown in Fig. 1(b). Moreover, the majority of the Bi2O3 phase in c5 could mainly remain as δ-BYO, and the β-phase (β-BYO indicated by the arrows,), was identified as a minority phase when the Bi2O3 loading was 50 wt%. As the Bi2O3 loading increased and approached 90 wt%, the δ-BYO signal disappeared along with the formation of pronounced β-BYO reflections.
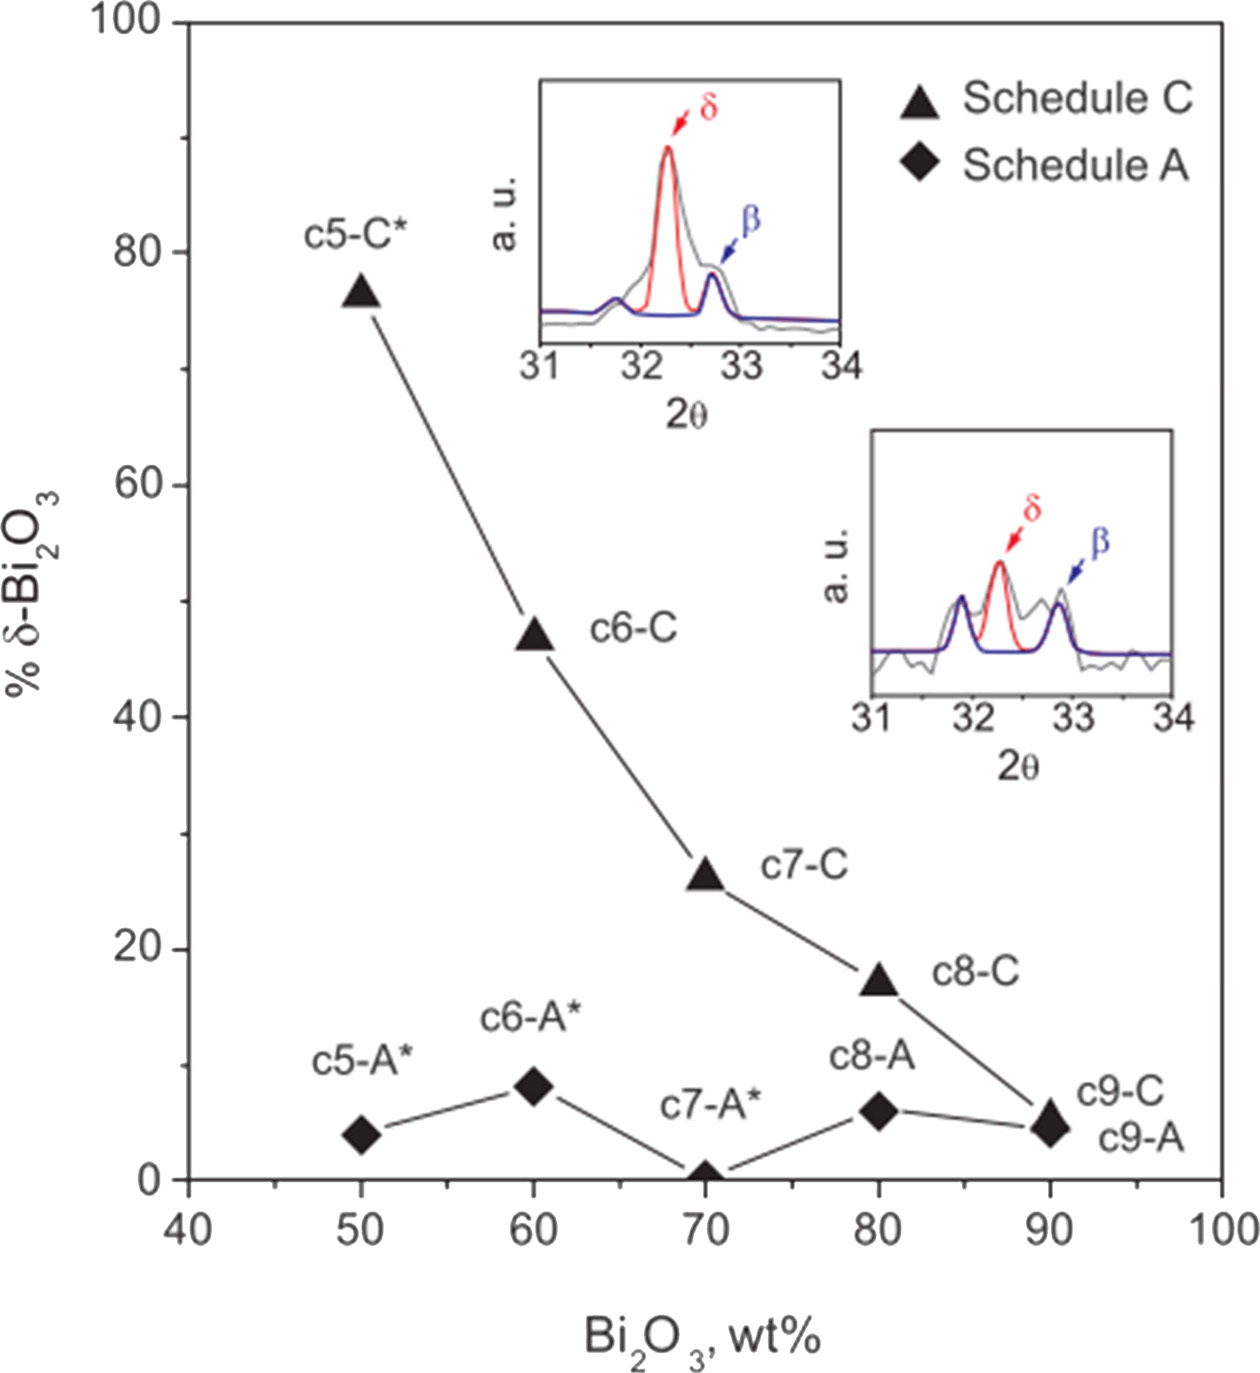
Fig. 2 shows a quantified plot of δ-BYO content relative to β-BYO for the LPS or SSS treatments at each Bi2O3 loading. The results of the sintering at liquid state showed that less than 10% δ-BYO was retained even when the temperature of 900 ℃ was only maintained for one min or longer. The same trend was observed for all composites with different compositions from 50 wt% to 90 wt% Bi2O3. At 750 ℃, the samples sintered at schedule C could enhance the proportion of δ-Bi2O3, i.e., from 5.2% δ-Bi2O3 (in c9 sample) up to 76% δ-Bi2O3 (in c5 sample).
In the ZrO2-Y2O3-Bi2O3 ternary system where Y2O3 was the primary stabilizer of ZrO2 and Bi2O3, the formation of the δ-phase content implied the possible inter-diffusion of Y2O3 for the stabilization of δ-Bi2O3, and possible destabilization of YSZ. This might happen in solid or liquid state, resulting in the formation of m-ZrO2.
|
Fig. 1 (a) XRD spectra of 50 wt% to 90 wt% Bi2O3 in 8YSZ processed with thermal schedule A. (b) XRD spectra of samples sintering at 750 ℃ for 1 hr. |
|
Fig. 2 Quantified δ-Bi2O3 content relative to β-Bi2O3 of two sets of the Bi2O3-8YSZ composites analyzed from previous XRD spectra. |
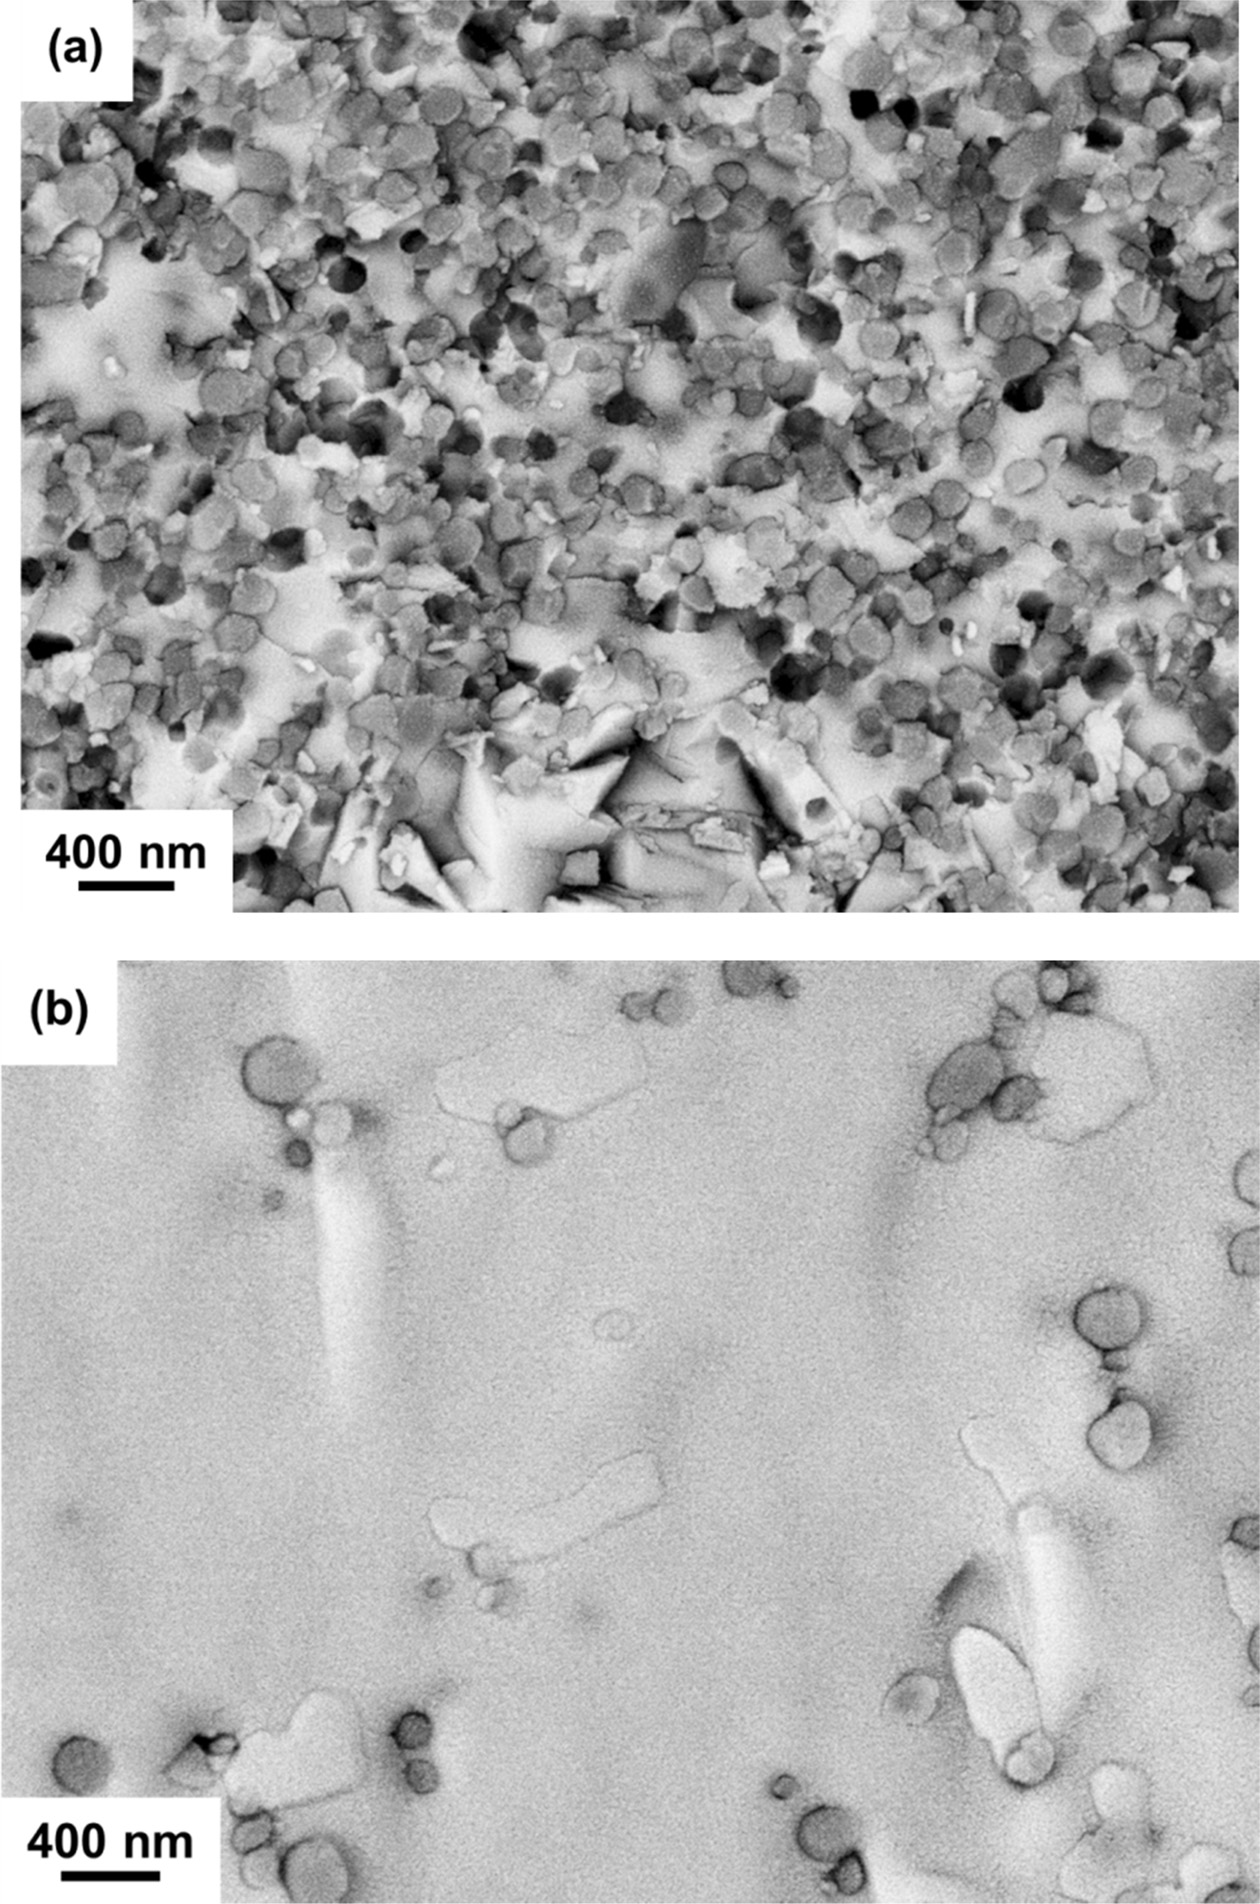
The microstructures of two Bi2O3-rich matrices are shown in Fig. 3. The results of SEM micrographs indicated that the Bi2O3 matrix contained randomly dispersed 8YSZ particulates of an average diameter of 200 nm. Increase in average grain size with increasing sintering temperature was also observed. A statistical quantification of the matrix free-space between 8YSZ spheres was measured, showing an average spacing of the samples to be 73 nm and 610 nm for c6-A and c9-A, respectively. The significance of the free-spacing of Bi2O3 matrix concerned with the diffusion distance of Y and stabilization of δ-BYO. The formation of δ-BYO could explain the accumulation of enough Y2O3 content in the neighbor Bi2O3-rich phase as well as the composite CTE.
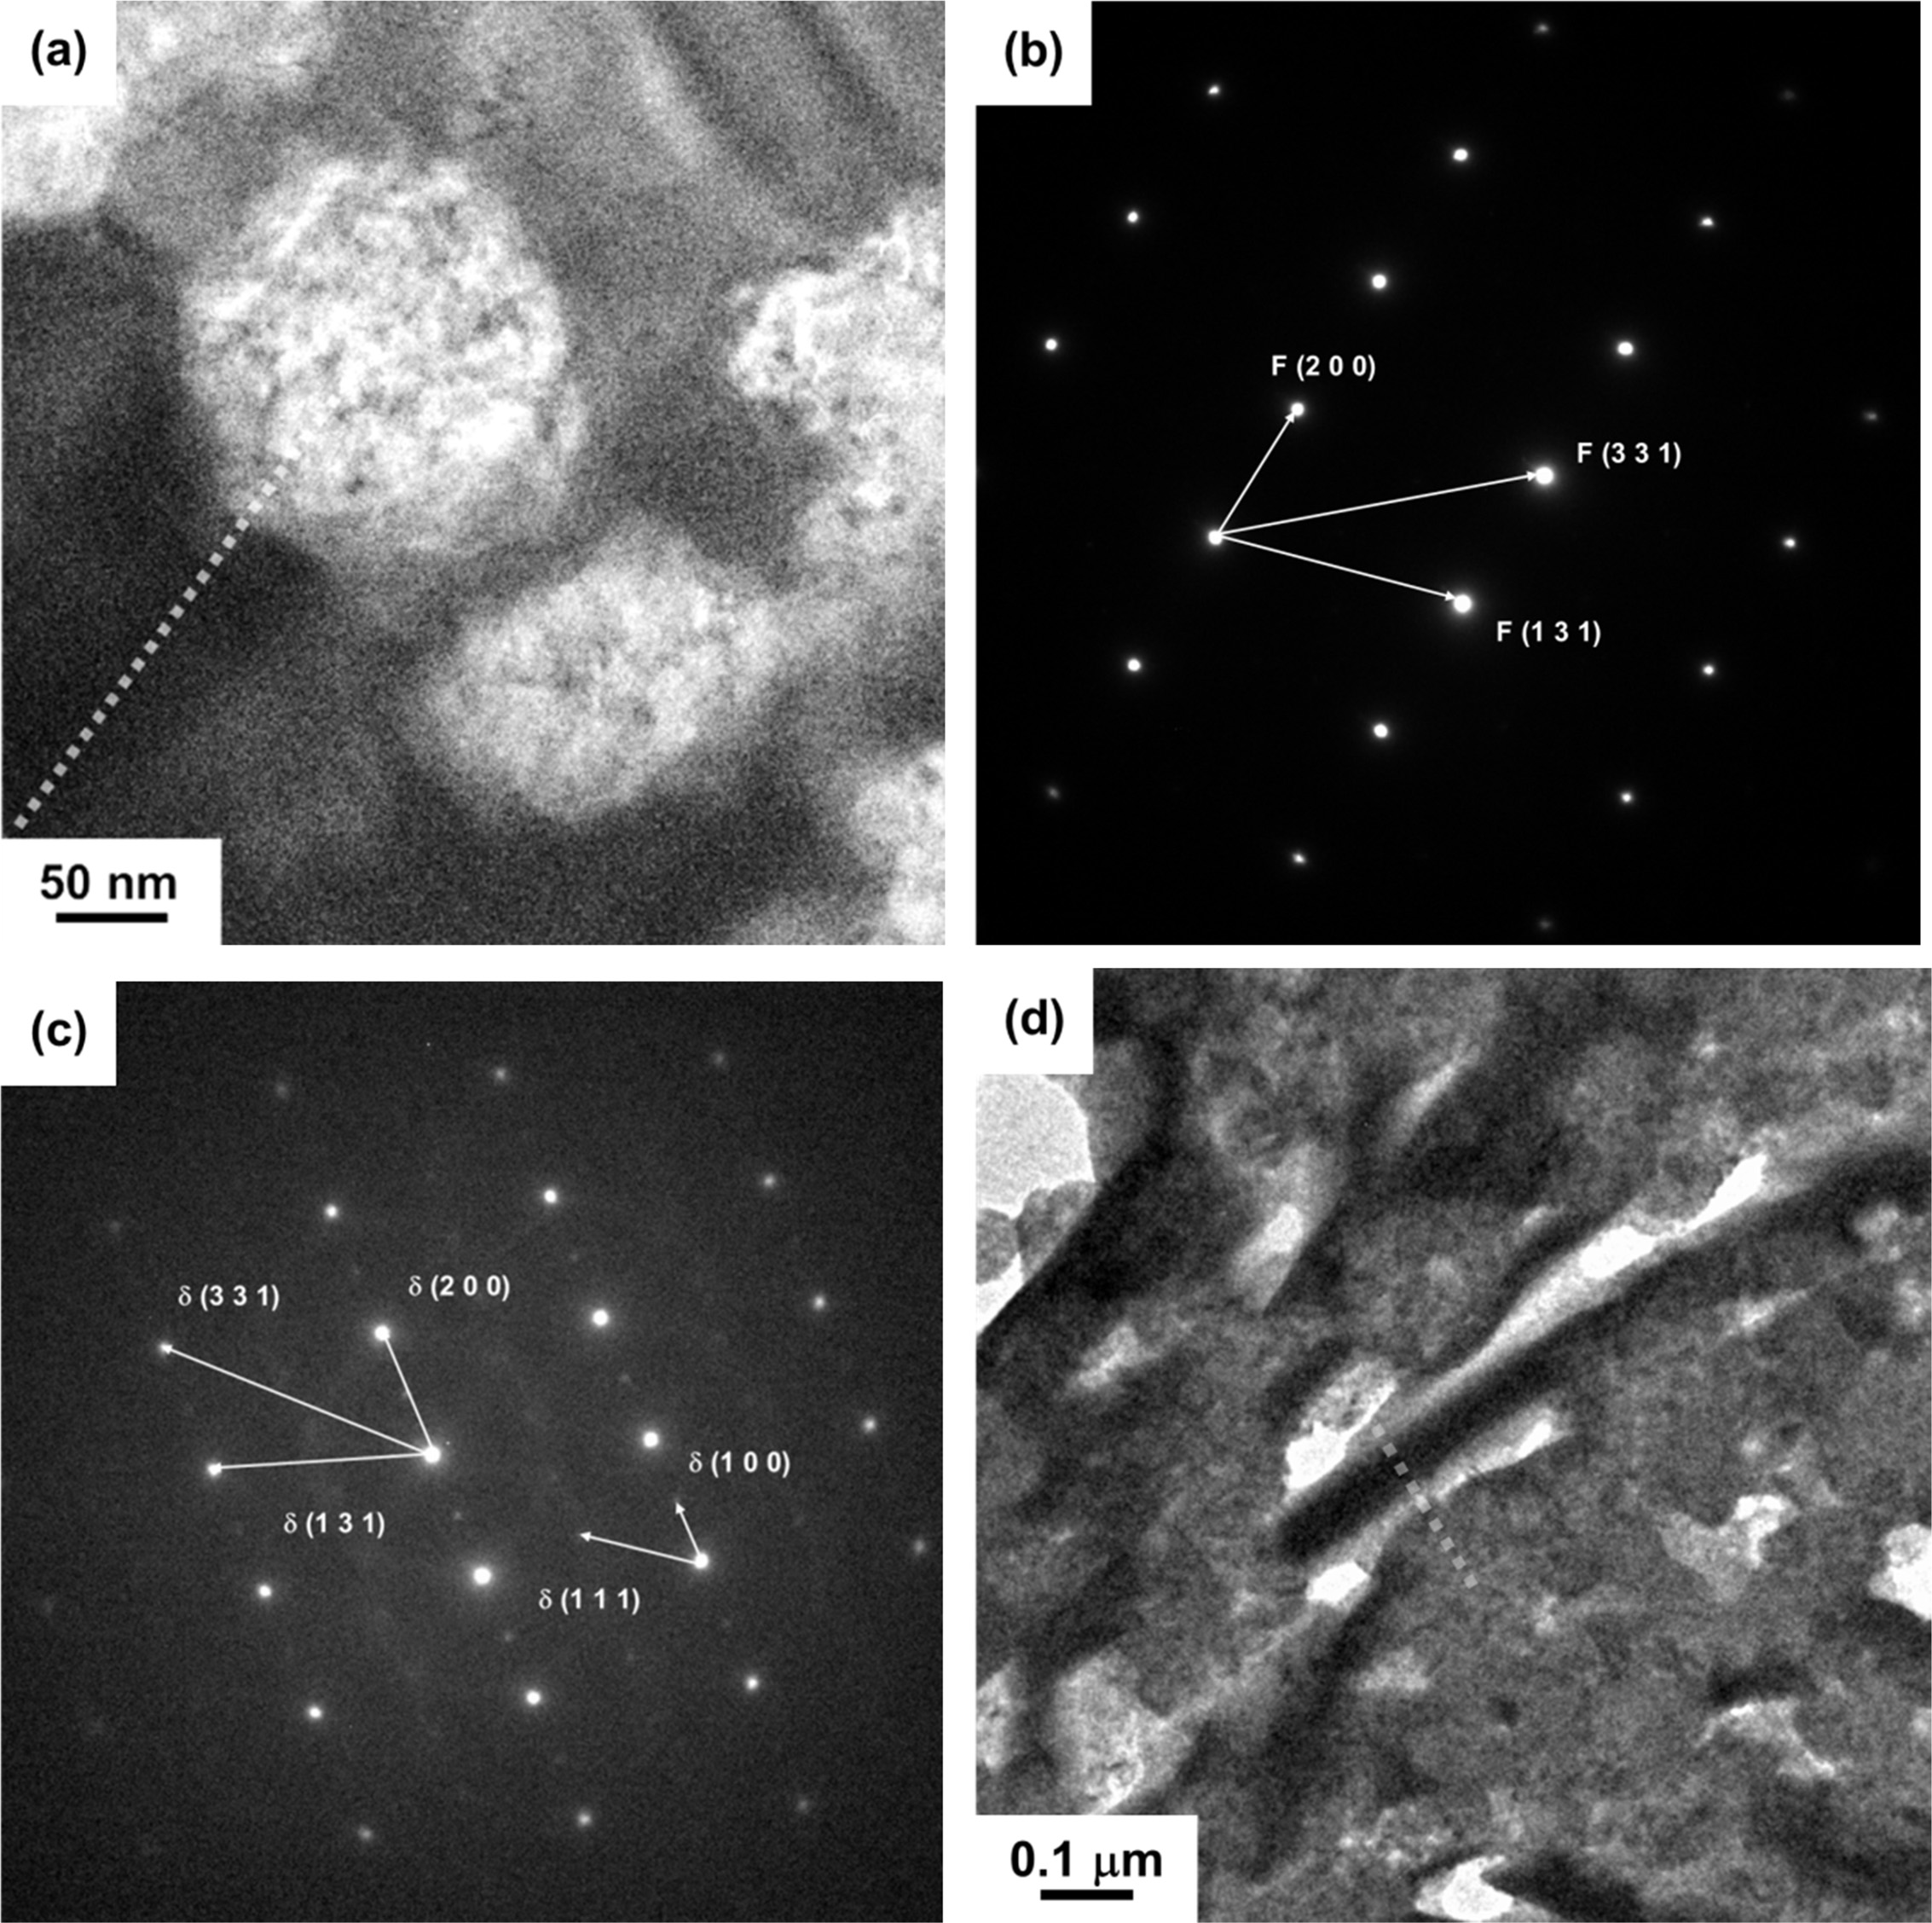
Fig. 4(a) shows the TEM image of the c5-A sample illustrating 8YSZ grains embedded into a dense Bi2O3 matrix. The diffraction patterns for the 8YSZ sphere with a brighter contrast and the Bi2O3 matrix with darker contrast are indexed both having a zone pattern <0, -1, 3>fluorite belong to fluorite structure, as shown in Figs. 4(b) and 4(c), respectively. Fig. 4(d) shows a porous region of the Bi2O3 matrix with a dark platy crystal, a β-Bi2O3 crystal, which is too small and not identified by electron diffraction2), but by EDX in Fig. 5. The existence of porous regions was possibly due to a volume contraction by the δ- to β-phase transformation.
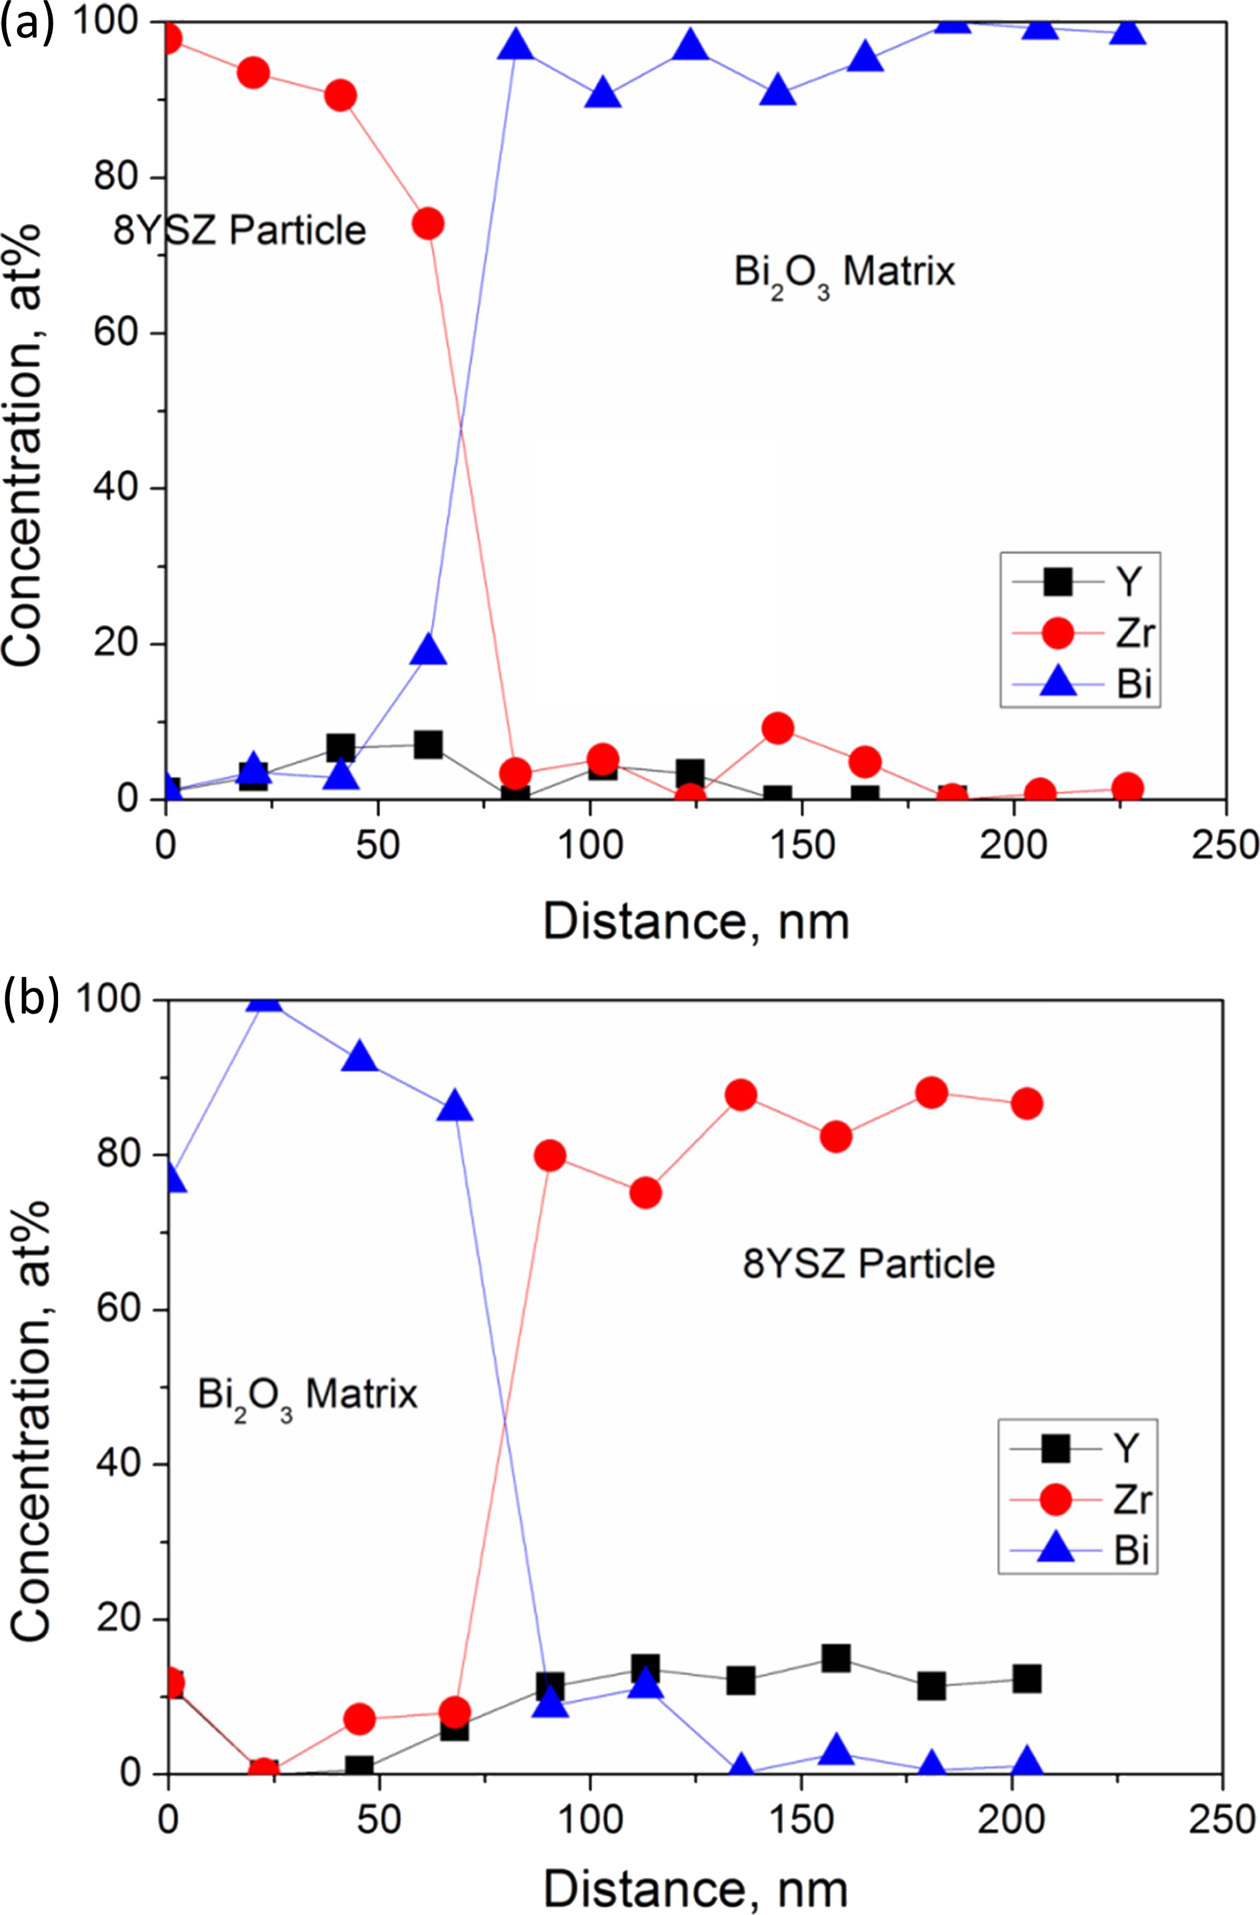
The EDS quantitative composition results as shown in Fig. 5 are also obtained by the analytical TEM nano-probe method. The spatial resolution of the elemental composition was found to be as small as 10 nm. The elemental results have been simultaneously calibrated by a near-by 8YSZ grain. The results could depict two important evidences as follows: (i) ZrO2 could diffuse into Bi2O3 in a distance of ~30 nm causing a content as much of 10 at%, more than that of Y2O3 in a content (below 5 at%.). (ii) hardly no Y2O3 was seen in a diffusion distance of > 15 nm to the Bi2O3-rich regions, but 3 and 30 mol% ZrO2 in Bi2O3 were observed in c5-A and c5-C samples, respectively. The latter case very likely could help the stabilization of δ-zirconia stabilized Bi2O3 (δ-ZYBO).
The critical diffusion distance seen in the Bi2O3 grains in a vicinity of 15-30 nm, was denoted as an “effective diffusion zone”. This zone could represent the appreciable amount of stabilized δ-ZYBO in the composite, resulting in a continuous δ-ZBO matrix in a connected network, as shown in Fig. 3(a).
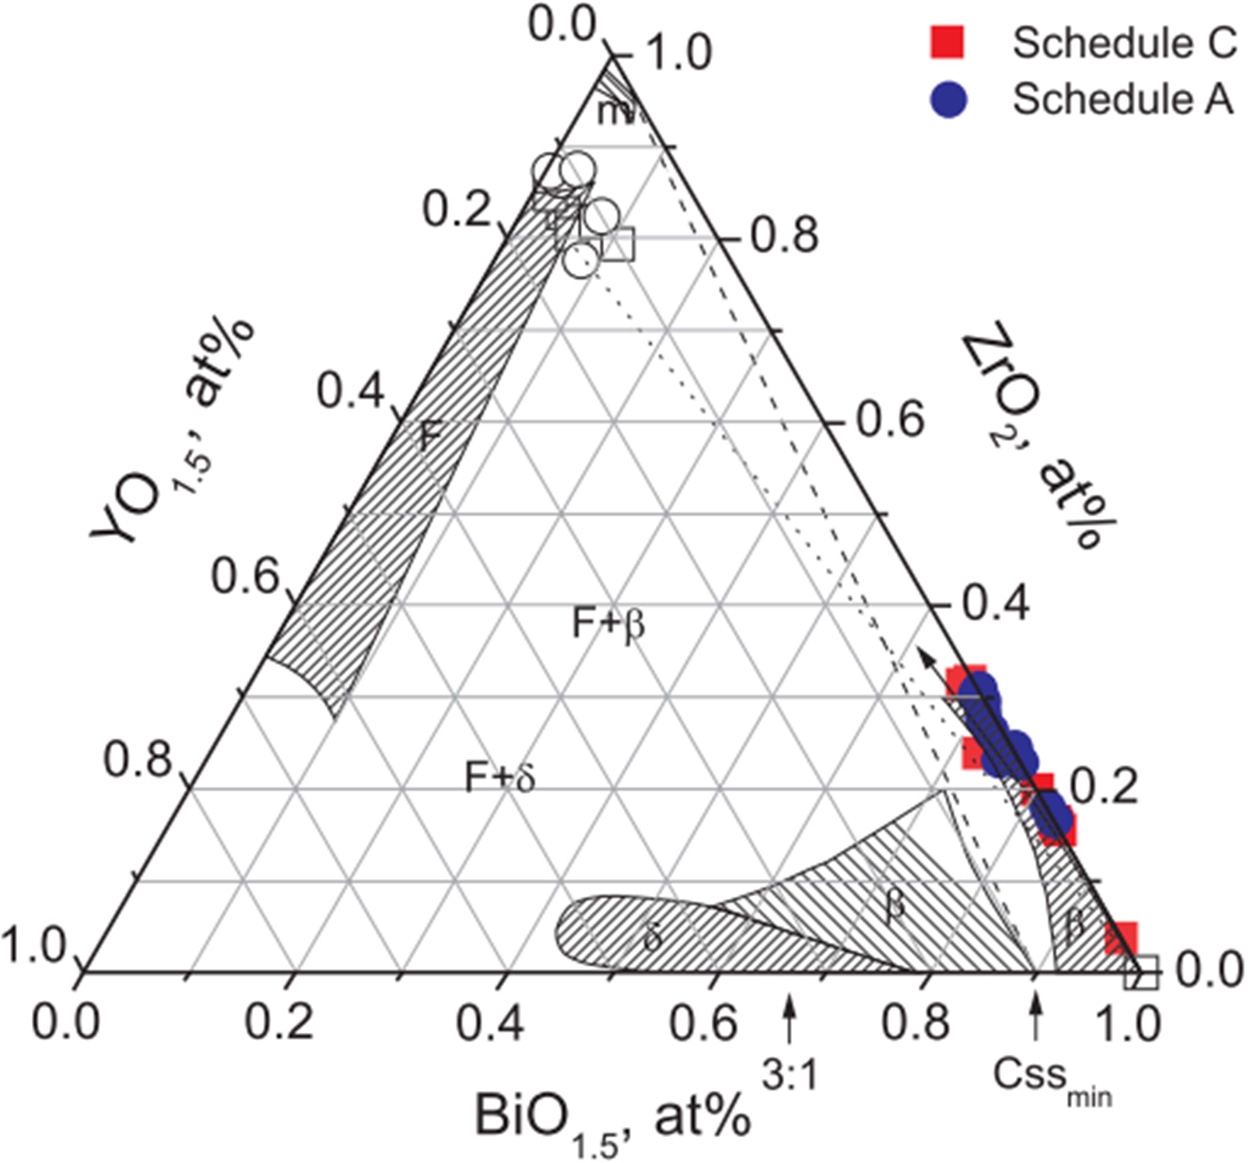
The compositional analysis of the sintered samples is summarized in Fig. 6, by the color notations of the ZrO2-Y2O3-Bi2O3 ternary system, which was replotted [14] and shown with compositional variations within the diffusion zone obtained with previous quantitative analysis of SEM and TEM EDS across a coupled interface of various 8YSZ and Bi2O3. Compositions marked by open symbols were those away from the diffusion zone. The compositions 8YSZ and Bi2O3 was connected by one tie-line (the dot line) that could distinguish low Y2O3 regions. The other line (the dash line) connects the m-ZrO2 (but with 2 mol% Y2O3) and β-phase Bi2O3 (with 10% mol% Y2O3) [17] annealing between 827 ℃ and 977 ℃, which is consistent with the results report by Keizer et al. [14]. However, it was suggested that a stabilized δ-phase Bi2O3 composition would require a heavy dopant (at least 10 mol%) into Bi2O3.
The filled compositional points measured within the zone in the Bi2O3-rich region indicate a slight preferential diffusion of Zr over that of Y, especially in the Bi2O3 matrix. This trend is consistent with the size effect of Zr4+ < Y3+ < Bi3+. As the compositions at 8YSZ/Bi2O3 interface maintain at high temperature than the Tm (825 ℃) of Bi2O3, a peritectic reaction (as below) is likely to occur in LPS-processing composites, leading to the formation of products as follows:
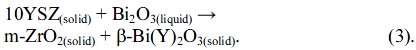
Thus, two phases, a pure m-ZrO2 and the first minimum cubic β-Bi(Y)2O3 solid (i.e. 10YSB [20]) at the reaction temperature, would be kinetically enhanced by the presence of the liquid phase. However, no liquid phases were formed in solid state sintering, instead of that a limit inter-diffusion in solid state was resulted, i.e. Zr ions could diffuse into Bi2O3 in a faster rate than that of Y, as shown in Fig. 6(a), and thus could form an appreciable zone thickness of ~100 nm in Bi2O3. This layer assures the formation of δ-ZYBO phase and its stability in the temperature region from room temperature to 650 ℃. This indeed indicate that any (Zr,Y)-stabilized δ-Bi2O3 is located next to 8YSZ spheres in the zone. Thus, the above results demonstrate that Bi2O3 presented in grains and grain boundaries, are expected to enhance the density and ionic conductivity of the material.
|
Fig. 3 High magnification SEM images of polished (a) c6-A and (b) C9-A dense composites. The image was obtained by backscattered electron (BE) detector. The 8YSZ particles appear in the features with a darker contrast. |
|
Fig. 4 (a) TEM image of the cross section of c5-C sample illustrating the 8YSZ particulates embedded in the Bi2O3 matrix sintered by SSS. The image was taken without objective aperture to reveal Bi2O3 matrix as the regions of darker contrast. TEM diffraction pattern of (b) the pointed 8YSZ particulate and (c) the Bi2O3 matrix. (d) A TEM image of Bi2O3 matrix in a porous region in c5-A. The Bi2O3 crystals in (d) was identified as β-Bi2O3. |
|
Fig. 5 Nano-probe elemental profiles over the dashed line drawn in previous figure, (a) the dot line in Fig. 5(a) of c5-C sample; (b) the dot line in Fig. 5(d) of c5-A sample. |
|
Fig. 6 Replotted ZrO2-Y2O3-Bi2O3 ternary phase diagram [14] with the measured composition data of the diffusion zone between bulky Bi2O3 and 8YSZ using SEM EDS. Compositions marked by rectangular (■,□) and circular (●,○) symbols are those of the thermal schedules C and A, respectively. Shaded areas are phase regions referenced to Keizer et al. [14] The notations, m and F are monoclinic and cubic fcc phases of ZrO2; δ’ and β’ are cubic and tetragonal solid solutions doped by ZrO2 and Y2O3, respectively. Two-phase regions of F+β’ and F+δ’ been reported by Keizer et al., but no boundaries are noted. |
The diffusion and composition analysis reported by previous studies suggested two stabilization mechanisms for the formation of composites; (i) stabilization of a high purity Bi2O3 through introduction of heterogeneous interfacial diffusion of ZrO2, and (ii) enough heavy Zr and Y accumulation within the zone leading to δ-cubic solid solution.
According to Kim’s interpretation [17] of the ternary phase diagram, m-ZrO2 crystals would precipitate near the 8YSZ-regions. In thermal schedule A, the presence of a melting phase would prevent a significant local build-up of Zr(Y)-doped Bi2O3 region, instead of m-ZrO2 layer. But the rich Y accumulation was not found for c5-A sample (Fig. 5(b)). Instead, no m-ZrO2 precipitation was found in the samples by solid state treatment.
At lower sintering temperatures (750 ℃), both two types of geometrical factors and annealing time could determine the phase retention of the zone in matrix as shown in Fig. 4(a). The results indicated a dense region where δ-ZYBO matrix was formed during the thermal schedule, and constrained by those surrounded 8YSZ particles upon cooling to room temperature. Fig. 4(c) provides the evidence of extra diffraction intensity suggesting the very possible oxygen vacancy ordering in the δ-ZYBO in both (1 0 0)δ and (1 1 1)δ directions. Thus, it was clearly stated that the Bi2O3 matrix has transformed to a thermodynamically stable δ-ZYBO. However, due to the CTE difference between δ-ZYBO and 8YSZ, an internal tensile stress in the matrix could quench the δ-phase Bi2O3 effectively upon cooling. In contrast, β-Bi(Zr)O grains as shown in Fig. 4(d) are free to crystallize leaving the nearby porous regions. Based on the results, the SSS schedule capable of retaining dense δ-phase matrix in the composites appropriately by doping yttria and zirconia, is suggested as the appropriate thermally treated composite.
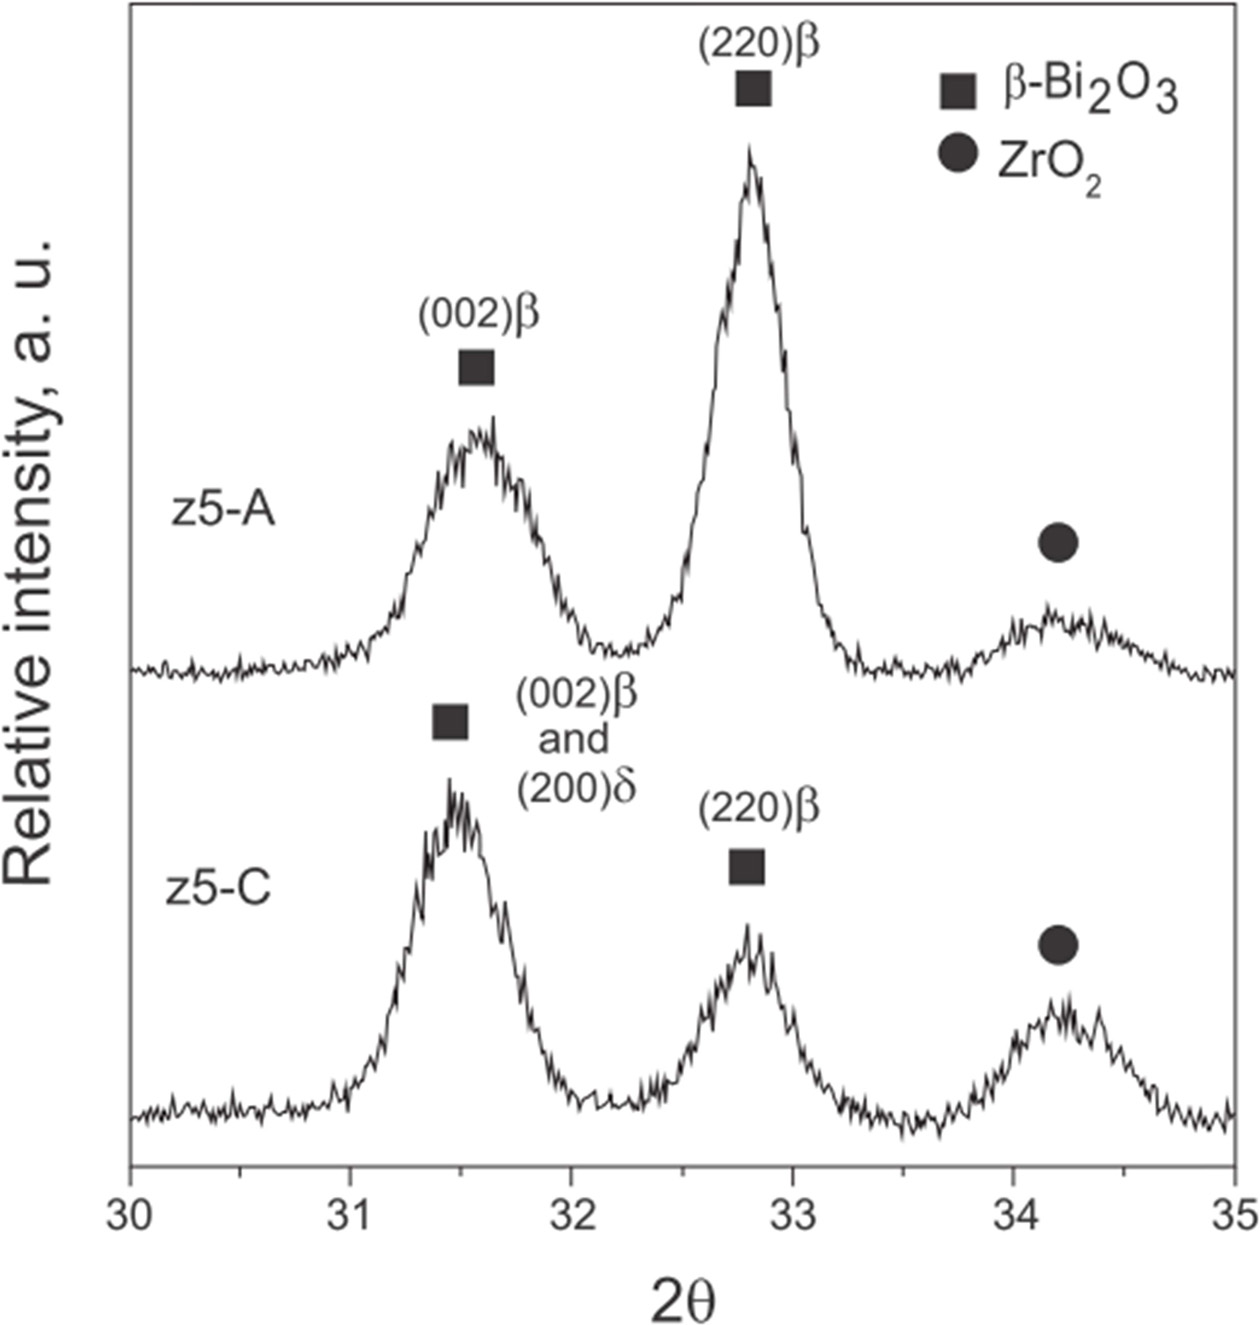
Fig. 7 displays two pure z5 (50% ZrO2) samples sintered with 50 wt% Bi2O3 under thermal schedule A or C. The comparison analysis of (c5-A and c5-C) the critical diffraction pattern between 30o-35o 2θ, two diffraction peaks (002)β and (220)β indicated the possible formation of β-Bi2O3 only with no δ-phase by schedule A. However, an appreciable δ-Bi2O3 content was significantly observed [(200)δ at 31.5o 2θ] in z5-C by the schedule C. Thus, the diffusion of zirconia in 8YSZ or pure ZrO2 particles was a clear evident for the fact that the diffusion could play vital role on the preservation of δ-Bi2O3 matrix.
|
Fig. 7 XRD spectra for the composites (z5) with 50 wt% pure ZrO2 sintered with thermal schedules A and C. |
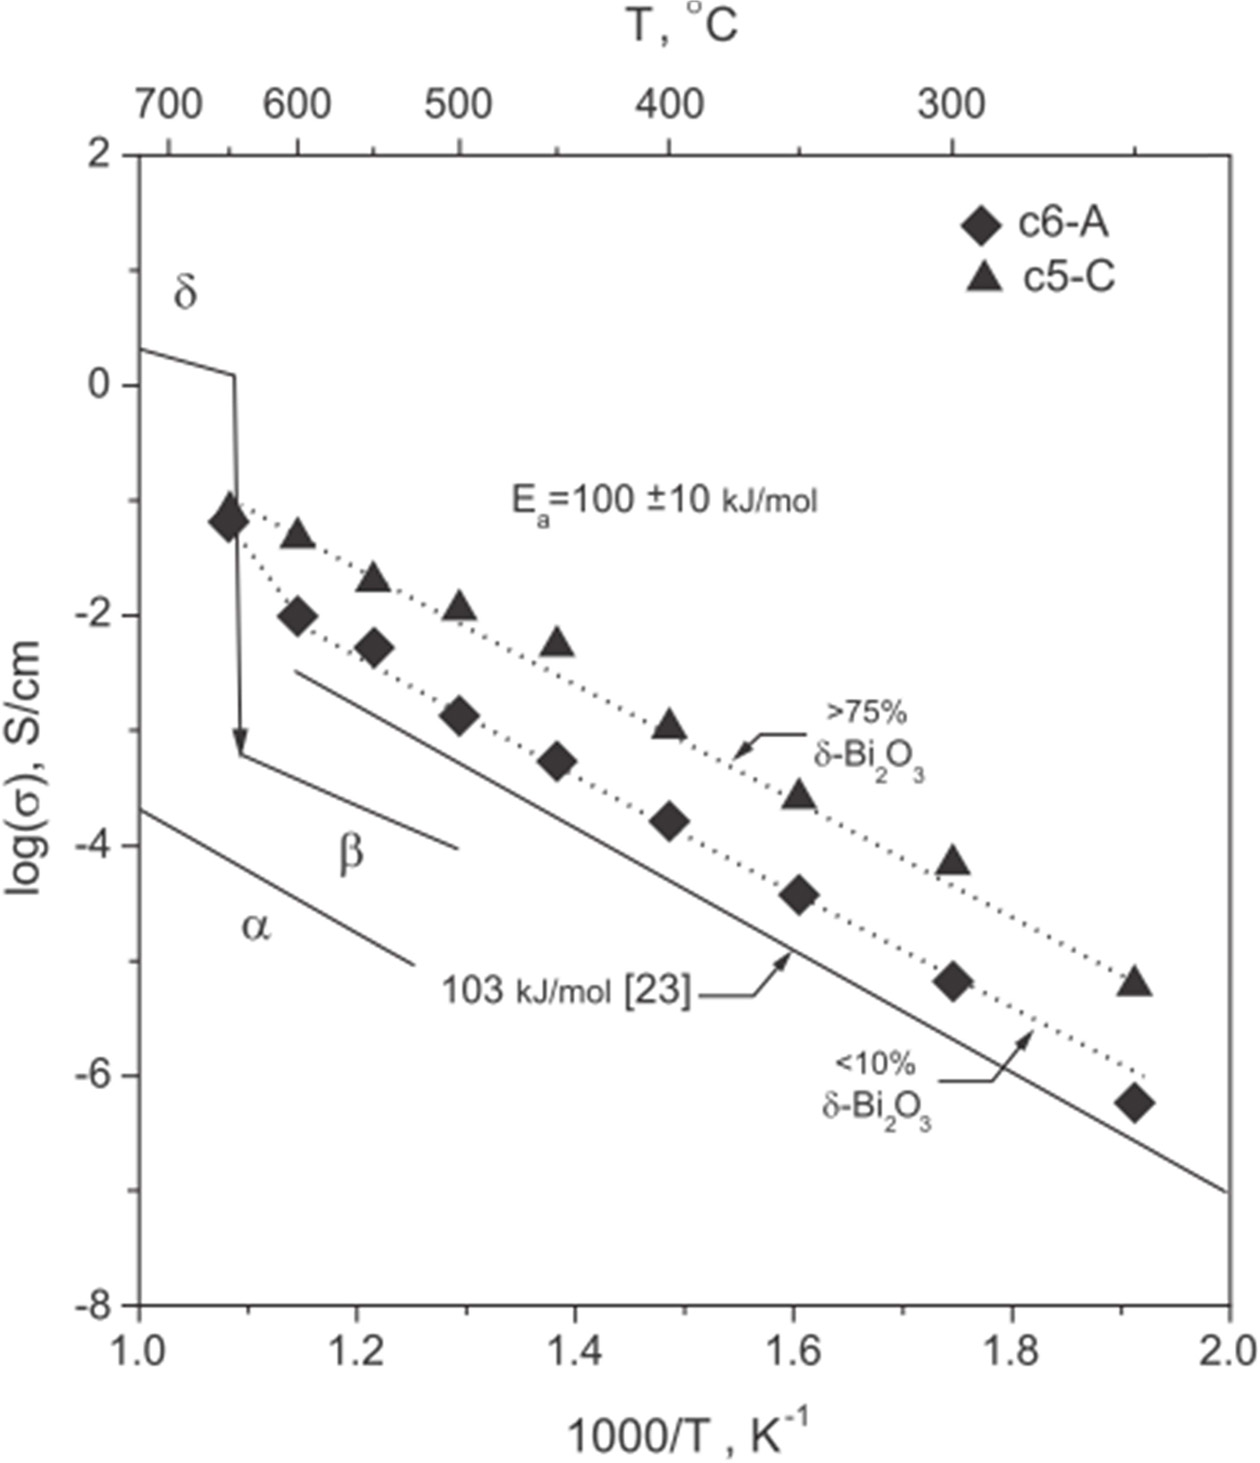
Figure 8 shows Arrhenius plots of DC conductivities of selected samples. The samples fall into two sets of Arrhenius behavior from 250 ℃ to 600 ℃. At 650 ℃, the conductivity of c6-A experienced an Arrhenius bend at > 600 ℃, towards a higher activation energy. The unusual bend confirmed the conductivity of 2.5-10% Bi2O3-8YSZ reported by Kusuma [18]. However, such unusual bend was never reported in the electrical data of Kim’s work [17]. Phase changes of β- to δ-phase are expected at > 600 ℃ (the bend), and contribute better ionic conductivity. The liquid-phase sintered samples showed slightly poor conductivity than the expected value for the composites containing β-ZYBO/8YSZ. This improved conductivity is in good agreement with the results reported by Kims and Kusumas. It is also noted that even holding schedule A for 1 min could not enhance δ-phase because of the reason that a shorter LPS sintering period (1 min), is not able to increase the fraction of δ-Bi2O3-phase.
Activation energy below 600 ℃ was calculated to be 100±10 kJ/mol, which was found to be below than that of pure 8YSZ (103 kJ/mol) [23]. Since 8YSZ showed a higher conductivity than that of β-Bi2O3, mixed conduction of the mixture (8YSZ, β-Bi2O3, and δ-Bi2O3 phases) was expected under the circumstance that any δ-Bi2O3 grains were contributing the ionic conductivity, and thus the mixture could exhibit an enhancement in the conductivity than that of 8YSZ.
Contrarily, the sample c5-C with a fraction of 76% δ-Bi2O3 in the Bi2O3-rich matrix below 650 ℃ showed the conductivity about an order higher than those treated at schedule A. The increase in the conductivity at the temperatures ≤ 650 ℃ resulted into a single linear Arrhenius relationship. The activation energy still remained in the range of 100±10 kJ/mol. However, the conduction mechanism was believed to be controlled by oxygen vacancy diffusion through a continuous network of δ-Bi2O3. Similar result was reported by Miyayama et al. [21, 22], i.e., the slope of the ≥ 85 mol% of YSZ in 20YSB increased with obscured bend of the conduction data lines above and below 550 ℃. However, the conductivity of their samples below a fraction of 30 mol% 20YSB dropped significantly, which implied that their conductive Bi2O3-rich phase was not able to form a continuous phase successfully.
|
Fig. 8 Arrhenius plots of DC conductivities of selected samples. Solid lines in the background indicate conductivities of pure α-Bi2O3, β-Bi2O3, δ-Bi2O3, and 8YSZ [23]. |
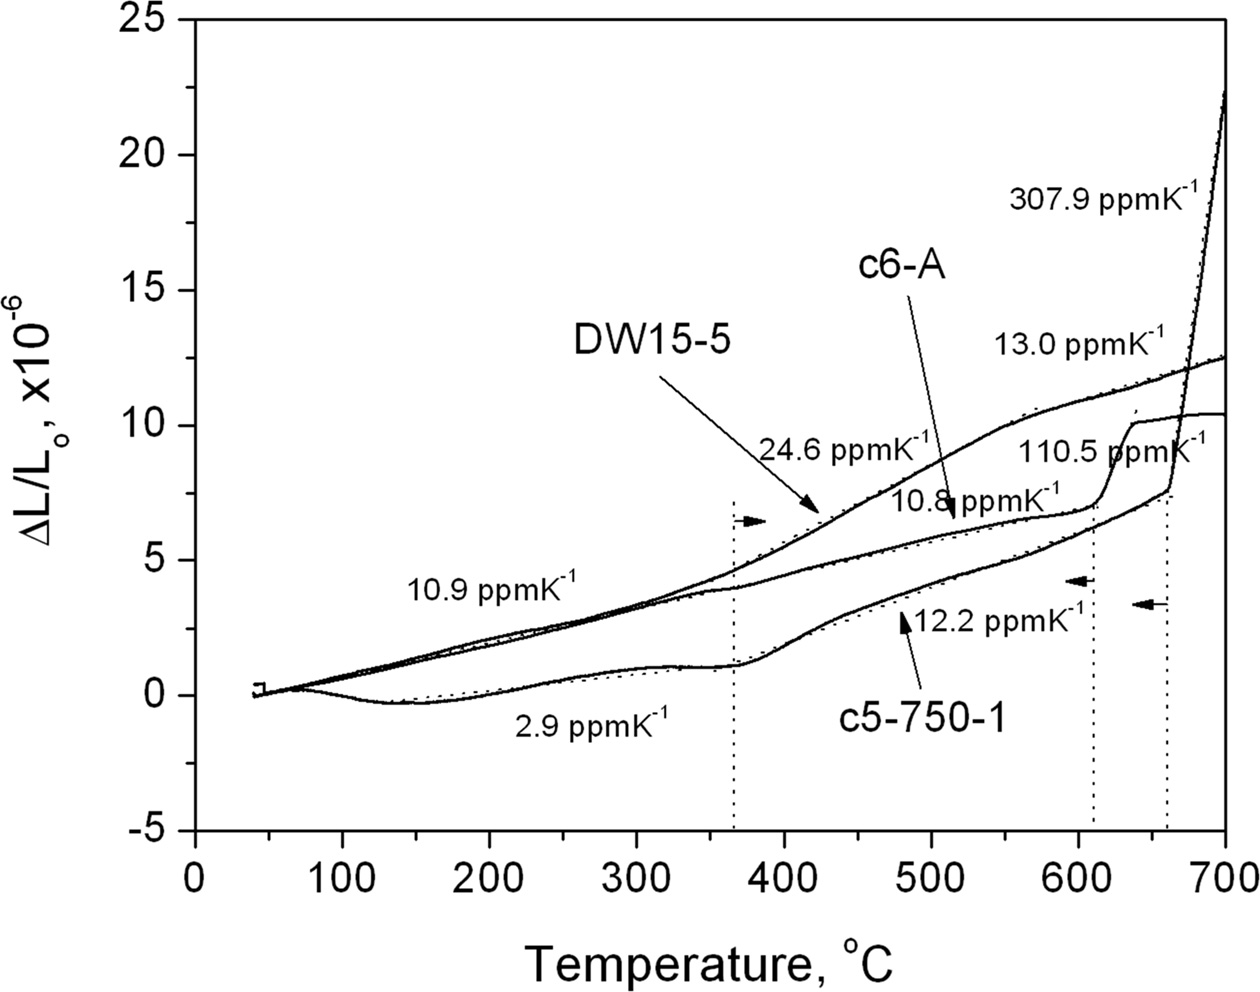
The comparison of the thermal expansion coefficients of the representative samples are shown in Fig. 9, where DW15-5 (15%Dy and 5%W co-doped) represents a stabilized single phase δ-Bi2O3 as a standard. Each of the other two samples exhibits several linear regions in the plot. If the CTE values were obtained from the linear region between 400 ℃ and 600 ℃, the data in the decreasing order were DW15-5 at 24.6 ppm*K-1, c5-c at 12.2 ppm*K-1, and c6-A at 10.8 ppm*K-1, respectively. The CTE value of DW15-5 is in good agreement with that of the literature values [1] at greater than 20 ppm*K-1. In conjunction with the TEM observations, the presence of interconnected 8YSZ backbone structure in the C5-C further contributed to a much reduced CTE (10.4 ppm*K-1) at 50 wt% Bi2O3 content, which is matching well with that of 8YSZ.
|
Fig. 9 TMA curves for c6-A, c5-C, and a reference Dy-W stabilized δ-Bi2O3 from room temperature air to 700 ℃ at 10 ℃·min-1. |
With a composite approach, the Bi2O3-8YSZ material system of various compositions treated by two thermal treatments, i.e. liquid-phase sintering and solid-state sintering processes are reported. In the treated series, Bi2O3-8YSZ (c-5-C) in 50-50 wt% displays the Bi2O3 rich matrix phase showing 76% δ-phase Bi2O3 and surpassing a conductivity of 10-2 Scm-1 at 500 ℃. A straight Arrhenius relationship similar to typically Y2O3 doped homogeneous single phase δ-Bi2O3 ionic conductors suggests a conduction mechanism of oxygen vacancy diffusion in heavily doped Bi2O3. The δ-Bi2O3 matrix phase is found to contain enough quantity of Y2O3 and ZrO2, which is consistent with the data of the inter-particle spacing in the SSS processed samples. For c5-C sample, a measured value of 12.2 ppmK-1 of suggesting a rigid 8YSZ particulate-assembled composite structure in the c5 series.
The other processing route (schedule A) offers a quick peritectic reaction to form m-ZrO2 grains dispersed in recrystallized β-Bi(Zr,Y)2O3 matrix. In addition, detail microstructural TEM observations showed that β-grains were always formed with porous regions, Therefore, the composite, m-ZrO2/β-Bi(Zr,Y)2O3 could showed only the slightly better conductivity than that of 8YSZ [23].
The results suggests that the CTE of the composites is mainly controlled by the existing phases. It was noted that under the influence of both a constraint effect through introduction of heterogeneous interfaces and lean-doped (< 10 mol%) β-Bi (Zr,Y)2O3 grains, the composites by schedule A shows a linear thermal expansion, but expands greatly at > 600 ℃. In comparison, the composites mainly with dense δ-Bi2O3 matrix/8YSZ particulates processed by schedule C, are found to possess an average CTE between room temperature to 600 ℃, which could match with that of 8YSZ reinforced structure. Thus, the present study emphasizes that the composites exist a completely stable cubic phase could possibly enhanced by the grain growth, by reducing the sintering temperature, and thereby improved by a better ionic conductivity due to the stabilization of Bi2O3 by Y and Z co-doping.
The authors thanks helpful discussion with Dr. Y. Y. Chen and the funding given by MOST in Taiwan in a contract no. MOST 107-2221-E-002-019-MY2.
- 1. P. Shuk, H.D. Wiemhofer, U. Guth, W. Gopel, and M. Greenblatt, Solid State Ionics 89 (1996) 179-96.
-

- 2. T.C. Kuo, Y.L. Kuo, and W.C.J. Wei, J. Europ. Ceram. Soc. 31 (2011) 3153-58.
-
- 3. J.Y. Park, H. Yoo, and E.D. Wachsman, J. Am. Ceram. Soc. 88 (2005) 2402-2408.
-
- 4. J.S. Ahn, M.A. Camaratta, D. Pergolesi, K.T. Lee, H. Yoon, B.W. Lee, D.W. Jung, E. Traversa, and E.D. Wachsman, J. Electrochem. Soc. 157 (2010) B376-382.
-
- 5. K.Z. Fung, H.D. Baek, and A.V. Virkar, Solid State Ionics, 52 (1992) 199-211.
-
- 6. S.E. Lin, Y.R. Cheng, and W.C.J. Wei, J. Europ. Ceram. Soc. 31 (2011) 1975-85.
-
- 7. D.E. Alman, P.D. Jablonski, in “ Fuel Cell Technology, Markes and Commercialization, 2004 Fuel Cell Seminar Abstracts” (Albany Research Center, 2005) p.901604.
- 8. X. Ding, L. Gao, Y. Liu, Y. Zhen, and L. Guo, J. Electroceram. 18 (2007) 317-22.
-
- 9. A. C. Khandhar. US patent No. 5,171,645 (1992).
- 10. R. C. Weast, in “CRC handbook of chemistry and physics” (CRC Press, 1981) 62nd ed.
- 11. T. Takahashi, H. Iwahara, and T. Esaka T, J. Electrochemical Soc. 10 (1977) 1563-1569.
-
- 12. K.Z. Fung, and A.V. Virkar, J. Am. Ceram. Soc. 74 (1991) 1970-80.
-
- 13. R.K. Datta, and J.P. Meehan, Z. Anorg. Allg. Chem. 383 (1971) 328-37.
-
- 14. K. Keizer, M.J. Verkerk, and A.J. Burggraaf, Ceramurgia Int. 5 (1979) 143-7.
-
- 15. D.W. Joh, J.H. Park, D.Y. Kim, B.H. Yun, and K.T. Lee, J. Power Sources 320 (2016) 267-273.
-
- 16. T.H. Yeh, G.E. Kusuma, M.B. Suresh, and C.C. Chou, Mater. Res. Bul. 45 (2010) 318-323.
-
- 17. H. Kim, Ph. D. Thesis, The Ohio State University, USA (2004).
- 18. GE Kusuma, MS thesis, National Taiwan University of Science and Technology, Taiwan, ROC (2008).
- 19. Y.W. Lai, and W.C.J. Wei, Materials 9 (2016) 863
-
- 20. N. Jiang N, E.D. Wachsman, and S.H. Jung, Solid State Ionics 150 (2002) 347-53.
-
- 21. K. Huang, M. Feng, and J.B. Goodenough, Solid State Ionics 89 (1996) 17-24.
-
- 22. M. Miyayama, and H. Yanagida, Mater. Res. Bull. 21 (1986) 1215-1222.
-
- 23. M. Miyayama, T. Nishi, and H. Yanagida, J. Mater. Sci. 22 (1987) 2624-8.
-
- 24. C.C.T. Yang, W.C.J. Wei, and A. Roosen, Mat. Chem. Phy. 81 (2003) 134-142.
-
 This Article
-
2019; 20(4): 347-356
Published on Aug 31, 2019
- Received on Feb 8, 2019
- Revised on Jun 6, 2019
- Accepted on Jul 10, 2019
Services
- Abstract
introduction
experimental
results and discussion
conclusion
- Acknowledgements
- References
- Full Text PDF
Shared
Correspondence to
- Wen-Chen J. Wei
-
Dept. Mat. Sci. Eng., National Taiwan University, Taipei, Taiwan 106, ROC
Tel : +886-2-33661317
Fax: +886-2-23534562 - E-mail: wjwei@ntu.edu.tw
Clean-Energy Research Institute(CRI), Hanyang University, 222, Wangsimni-ro, Seongdong-gu, Seoul, 04763, Korea
E-mail: jcpr@hanyang.ac.kr