- Effect of sintering temperature on the relationship of electrical conductivity and porosity characteristics of carbon ceramic composites
Agus Edy Pramonoa,*, Muhammad Zaki Nuraa, Johny Wahyuadi M. Soedarsonob and Nanik Indayaningsihc
aDepartment of Mechanical Engineering, Politeknik Negeri Jakarta, Jl. Prof. Dr. G. A. Siwabessy, Kampus UI, Depok 16425, Jawa Barat, Indonesia
bDepartment of Metallurgy and Material Engineering, Universitas Indonesia, Kampus UI, Depok 16424, Jawa Barat, Indonesia
cResearch Centre for Physics, Indonesian Institute of Sciences, Kawasan Puspiptek, Gd. 440-442, Tangerang Selatan, Banten 15310, Indonesia
Experimental research on carbon ceramic composites fabricated from carbon and organoclay had been conducted. Electrical conductivity, specific wear rate, density and porosity, morphology, SEM EDX, and XRD were studied. The higher the content of carbon powder, the higher the electrical conductivity produced. Likewise, the higher the sintering temperature of composite increases the electrical conductivity of carbon ceramic composite. The higher the carbon powder content reduces the composite wear rate. Carbon content can increase the hardness of carbon ceramic composites. Composite density tends to be relatively stable with increasing sintering temperature. Increasing the content of carbon powder has shown to reduce composite density. The composite is getting lighter. The higher the carbon content in the composite increases the percentage of porosity of carbon ceramic composites, but it can still increase the electrical conductivity. Generally, carbon ceramic composites contain macroporous.
Keywords: electrical conductivity ceramics, specific wear rate, porosity, organoclay, coconut coir waste carbon, carbon ceramic composite
This research utilized local and waste material. The study utilized organoclay from Purwakarta, West Java, Indonesia as a ceramic matrix and carbonized coconut fiber waste as electrically conductive filler. Technologically, this study applied the ceramic sintering process with the pyrolysis method in an airtight furnace. The research has been conducted based on the study of similar research articles that have been carried out by other studies. The study of articles is oriented primarily on electrical conductive properties, composite wear resistance properties, physical properties of density and porosity, and composite elements. Clay is an important component in making ceramic mixtures, because of its plasticity, ease of use, strength and final properties obtained by heat treatment [1, 2]. Ceramics have excellent mechanical and thermal properties. This has been widely used for tribological applications. Friction arises as resistance to movement when a solid surface moves above another surface. Two-part surfaces rub against each other with high local pressure [3, 4]. Many functional elements, for example, cell electrodes, chemical sensors, thin conductive films, electrothermal heaters, etc. are made of conductive ceramic material [5]. Effect of ifon clay (Ondo State, Nigeria), and phase sintering temperature, and physical development of mullit-carbon ceramic composites are investigated. Researchers have used clay and graphite to make carbon ceramics [6]. Composites were synthesized from the same Si3N4 ceramic powder mixture, but used two different sintering techniques: (1) Hot Isostatic Pressing and (2) Spark Plasma Sintering [7]. Green ceramic composites was consolidated with various starches and sintered at different temperatures in the argon atmosphere. This carbon network produces porous composites that have high electrical conductivity, which depends on the type of starch and the nature of its porosity [8]. The composition of ceramic materials was prepared by incorporating waste into two types of clay, from Argentina and Brazil. The raw materials used in this work are (a) steel furnace waste to combine and (b) two different types of clay functions as matrices. Raw materials are characterized by mineralogical composition, chemical composition, and particle size distribution [9]. Ceramics from nanoscale hybrids formed from organoclays during pyrolysis have been made. This acts as a filler, amplifier, and binder for carbon/carbon composites. The heat pressing the organoclay forms black monolithic sheets with high thermal stability, electrical resistivity, flexural strength, modulus, and low ductility [10]. The engineering of ceramic composites with electrically conductive properties from Yb materials treated with CeO2 (Cerium oxide) nano powder material was carried out. The composite samples are heat treated at temperatures varying from 550 to 800 ℃, and produce electrical conductivity [11]. Design of carbon-clay composites, which are activated to decontaminate waste, made from clay and carbon materials. In this study, Fluesorb B (Chemviron Carbon) was chosen as an activated carbon, whereas a-sepiolite is a magnesium silicate clay used as an agglomerator to achieve the correct rheological characteristics when mixed with activated carbon and water to confirm the material in the form of monolithic, solid or shaped tube [12]. Carbon-based composites are known to have excellent tribo properties combined with high temperature stability that can be met using carbon-ceramic composites. In particulate composites, calcined oil coke, fly ash, silicon carbide, and boron carbide are used as reinforcement, while in the fibrous composite category; carbon fiber is used as an additional reinforcement. Comparison of carbon-based fly ash composites, carbon-based carbon-ceramic composites, and other carbon-ceramic particulate composites have been studied [4]. A new type of conductive aggregate is prepared for the first time by spreading ceramic matrix and dispersed graphite powder. Conductive aggregates are prepared in mortars containing carbon fiber, and electrical resistivity and piezoresistivity specimens are studied. The use of conductive aggregates in the mortar significantly improves its electrical conductivity [13]. Poly (ε-caprolactone) (PCL) nano- composites with carbon nanotube particles supported by clay are made by melting mixing. The mechanical, structural and thermal properties of nanocomposites were studied. Clay is from sodium montmorillonite (Zenith-N) from Milos, Greece [14]. The work of this study is to compare the fatigue behavior and oxidation resistance of CC composites derived from pitch with CC/ceramic composites (carbon/ceramic) obtained by impregnation of polysiloxane-based preceramic CC composites and subsequent heat treatment [15]. The effect of carbon nanotube on the mechanical properties and fire resistance of Homra / OPC mixtures has been studied; Homra is solid waste produced from the clay brick industry in Egypt. The compressive strength values were determined for different cement / CNT mixtures at each combustion temperature, in addition, the phase composition, thermal analysis, and microstructure were investigated for selected samples [16]. This study tested the volumetric properties of clay after compaction. An experimental investigation was carried out to determine the volumetric behavior of compacted expansive clay collected from Nanyang, China during compression of a constant water content [17]. This paper presents an experimental investigation on tensile strength of unsaturated clay, both in a reshaped and compacted state [18]. This study focuses on the behavior of clay from several deposits in the Metropolitan, Bernardo O'Higgins and Maule Regions can help support the important ceramics industry. Some clay deposits with industrial applications have studied. The chemical composition and clay mineralogy are determined by X-ray fluorescence and X-ray diffraction [19]. This study studied: 1. the possibility of using wastewater sludge from industrial uniforms as raw material, combined with kaolin clay for the production of white ceramics with mechanical properties that meet the criteria set by Brazilian technical standards; 2. Processes associated with the formation of white ceramic structures during sintering; 3. Development of new laboratory-level composites and sustainable technologies to produce white ceramics using hazardous sludge waste from the washing industry [20]. This paper, carbon fiber with a modified hydrophilic surface is added to the mortar cement through ultrasonic treatment. Mechanical and electrical properties of carbon fiber cement mortar cement are test to determine the effect of carbon fiber reinforcement. Adding carbon fiber to cement mortar increases compressive strength, and decreases the electrical resistivity of carbon fiber cement mortar [21]. Many studies have been carried out for the development of composite matrix ceramics and ceramics for industrial use because of their low density, high hardness, high wear resistance, toughness, mechanical strength and physical properties [6].
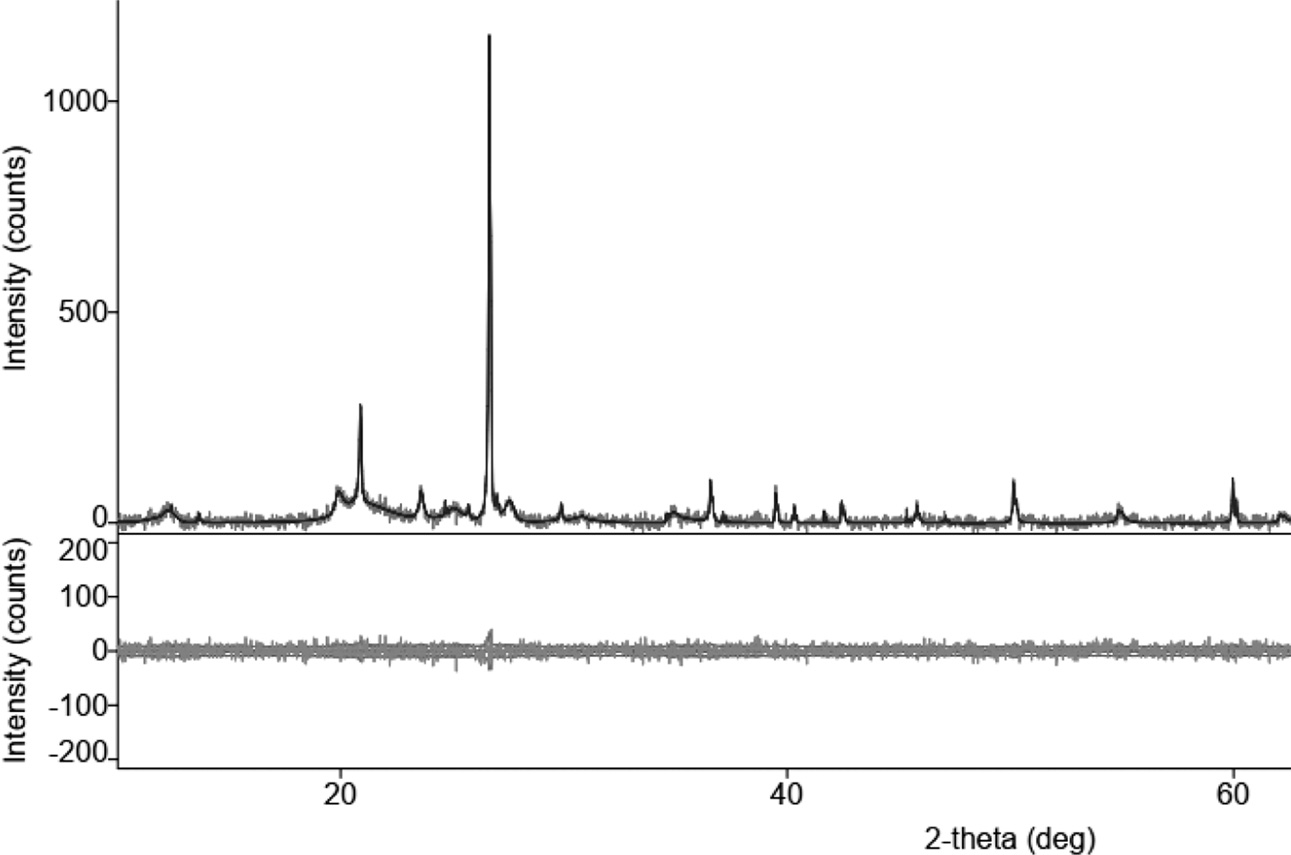
Organoclay material was purchased from Purwakarta, West Java, Indonesia. Element content of organoclay was tested with the X-ray fluorescence Analyzer TORONTECH TT – EDXPRT, the same thing was conducted by other researchers [19, 22, 23]. XRF and XRD test results show the elements contained in the organoclay, as shown in Table 1, and Fig. 1. The same techniques and results are also shown in other research results [1, 24]. The coconut fiber wastes was carbonized at a temperature of 950 ℃ (absolute), with a temperature speed of 2 ℃/minute. The coconut fiber carbon density are 0.45 [g/cm3], and the organoclay density is 1.14 [g/cm3]. Density testing was carried out by the Archimedes method, in a powder with 150-mesh.
|
Fig. 1 X-ray Diffraction of organoclay. |
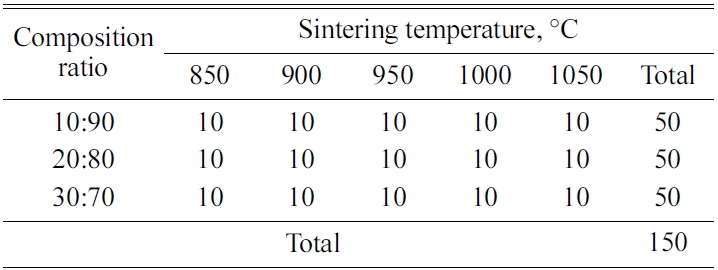
Carbon powder of coconut fiber 150-mesh was mixed with 150-mesh clay, with variations in composition of 10:90, 20:80, and 30:70% by weight, adding enough water to form mixed plastic properties. Moldings of green compact composite were conducted by hydraulic machines, with a pressure of 200 bars in tablet molds, with sizes of f 40 mm × 10 to 15 mm thick. The amount of each composition ratio was of 50 specimens, as shown in Table 2. Sintering was to convert green compact composite, a mixture of carbon and organoclay into electrically conductive ceramics. Clay will harden and become ceramic, while carbon powder becomes an electrical conductor. The sintering process was carried out in airtight reactor tubes at temperatures varying from 850; 900; 950; 1000; 1050 ℃. Temperature speed of 2 ℃/minute.
The measurement of the electrical resistance of carbon ceramic composite was conducted to determine the electrical conductivity of the composite material. Measurements were made by the two-point probe method, with a copper plate electrode. Electrical conductivity measurement followed ASTM D257 standards. Measurements were made on electrical resistance, specimen thickness, and cross-sectional area of specimens for electricity. Electric static resistance was calculated by the equation,
 [25] (1)
The magnitude of electrical conductivity were determined by the equation,
 [25] (2)
Note: ρ = static electricity resistance [Ωm]; R = electrical resistance [Ω]; A = cross-sectional area of composite specimens [m2]; l = current path length [m]; σ = electrical conductivity of composite specimens [1/Ωm] or [S/m].
The wear resistance test was carried out to determine the resistance of carbon ceramic composite materials to the friction mechanical load; the test was carried out by the disc wear tester method. This test follows the ASTM C1243-93 (2015) standard. Specific wear rates were calculated by equations,
 [26] (3)
Note: wrate = specific wear rate [mm3/Nm]; b = trace length [mm]; L = distance traveled [m]; P = load used [N]; r = the radius of the disc [mm]; B = trace width [mm]; h = trace depth [mm].
Density testing was carried out to determine the density of carbon ceramic composites. The test was carried out experimentally using the Archimedes method based on the ASTM D792 standard. The measurement of the density of carbon ceramic composites were calculated by the equation,
 (4)
(4)
Notes: ρcomposite = composite density [g/cm3]; ρwater distillation = water distillation density 0.992 [g/cm3]; WA = dry weight in air [gram]; WB = weight of saturated water in air [gram]; WC = weight of saturated water in water [gram].
Porosity testing follows the ASTM C20 - 00 (2015) standard. Visible porosity, P - The apparent porosity states as a percentage of the relationship of the open pore volume in the specimen with the exterior volume. Porosity was calculated as follows,
 (5)
(5)
The scanning electron microscope test was carried out by scanning electron microscopic Hitachi SU 3500, to determine the appearance of the bond morphology between the carbon powder and the organoclay ceramic matrix. To see the possibility of forming cavities in composites and interface bonds between clay and carbon powder.
The test was carried out with the Hitachi SU 3500 SEM machine, to determine the elements contained in bulk carbon ceramic composites. The test was carried out in conjunction with SEM morphology testing.
X-ray Diffraction (XRD) testing was carried out to complete the elemental content testing carried out with SEM EDX, to find out the shape of the mixed crystals of carbon composite ceramics.
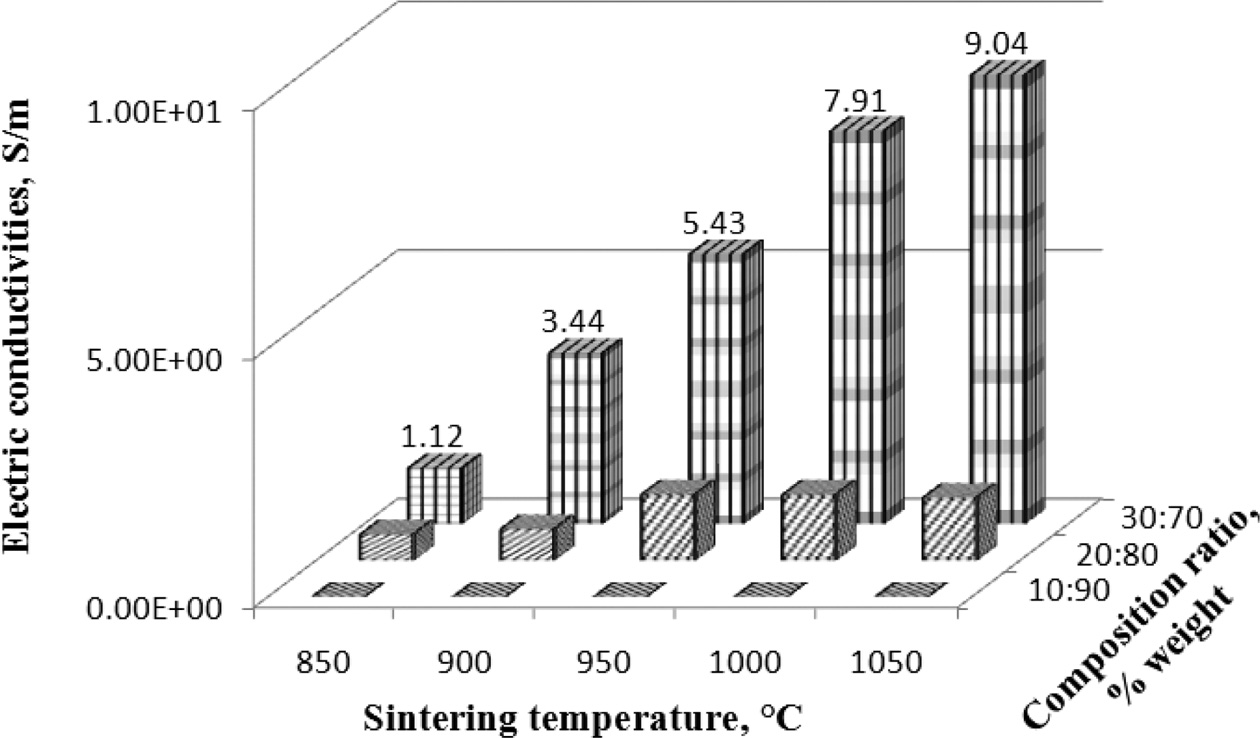
The purpose of measuring electrical conductivity is to determine the highest electrical conductivity of carbon ceramic composites composition. The results of the measurement of electrical resistance, cross-sectional area, and length of electric current flow are calculated by equation (1), and electrical conductivity is calculated by equation (2). The highest electrical conductivity of ceramic carbon composites was produced by a composition ratio of 30:70, at sinteringp temperatures of 1050 ℃, with an electrical conductivity value of 9.04 [S/m].
Meanwhile, the lowest value was produced by composites with a composition ratio of 10:90, with sintering temperatures 850 to 1050 ℃, all sintering temperatures with the composition ratio showed very low electrical conductivity values, from 0.00008 to 0.002 [S/m], as shown in Fig. 2.
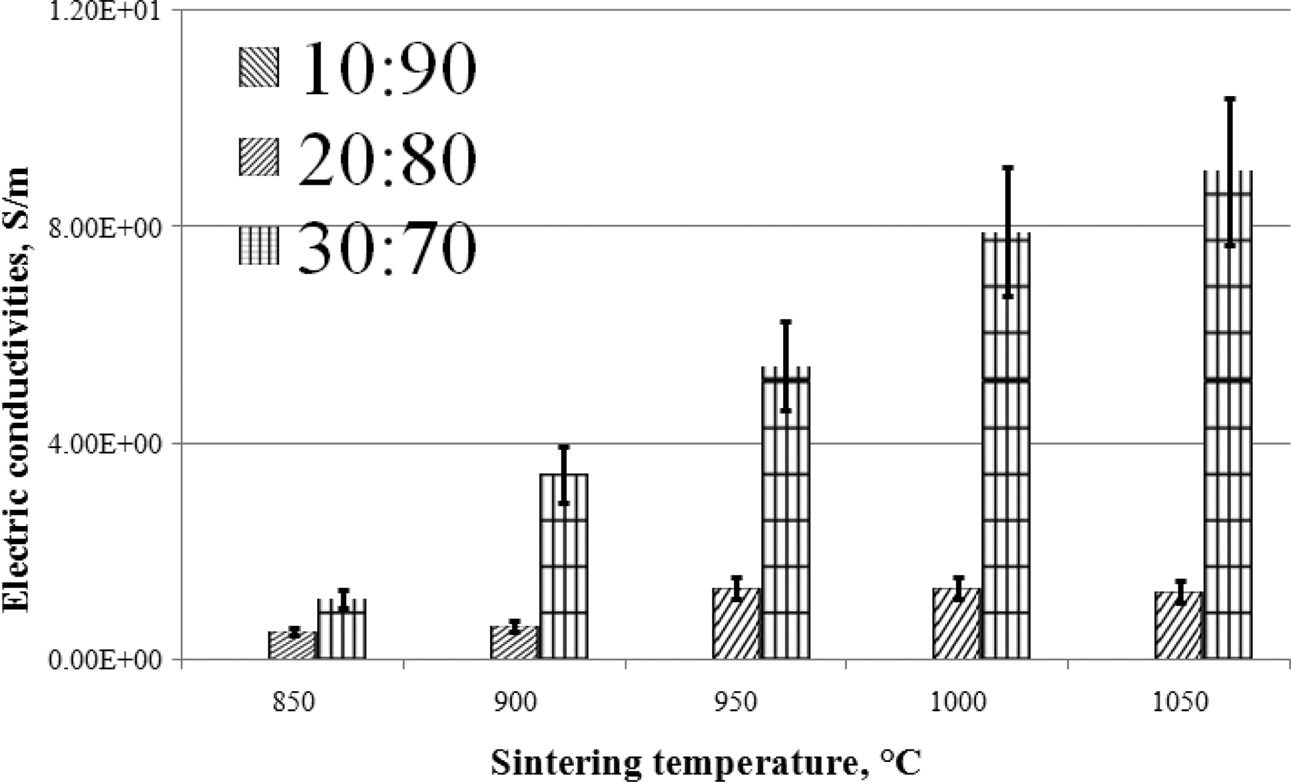
The graph shows that the higher the content of coconut fiber carbon powder, the higher the electrical conductivity produced by the composite. Likewise, the higher the sintering temperature of the composite, the higher the electrical conductivity of the composite. This is shown in Fig. 3. In comparison, other researchers showed measurements of the same electrical conductivity [2, 27-29].
|
Fig. 2 Electrical conductivity vs sintering temperature vs composition ratio. |
|
Fig. 3 Electric conductivities vs sintering temperature. |
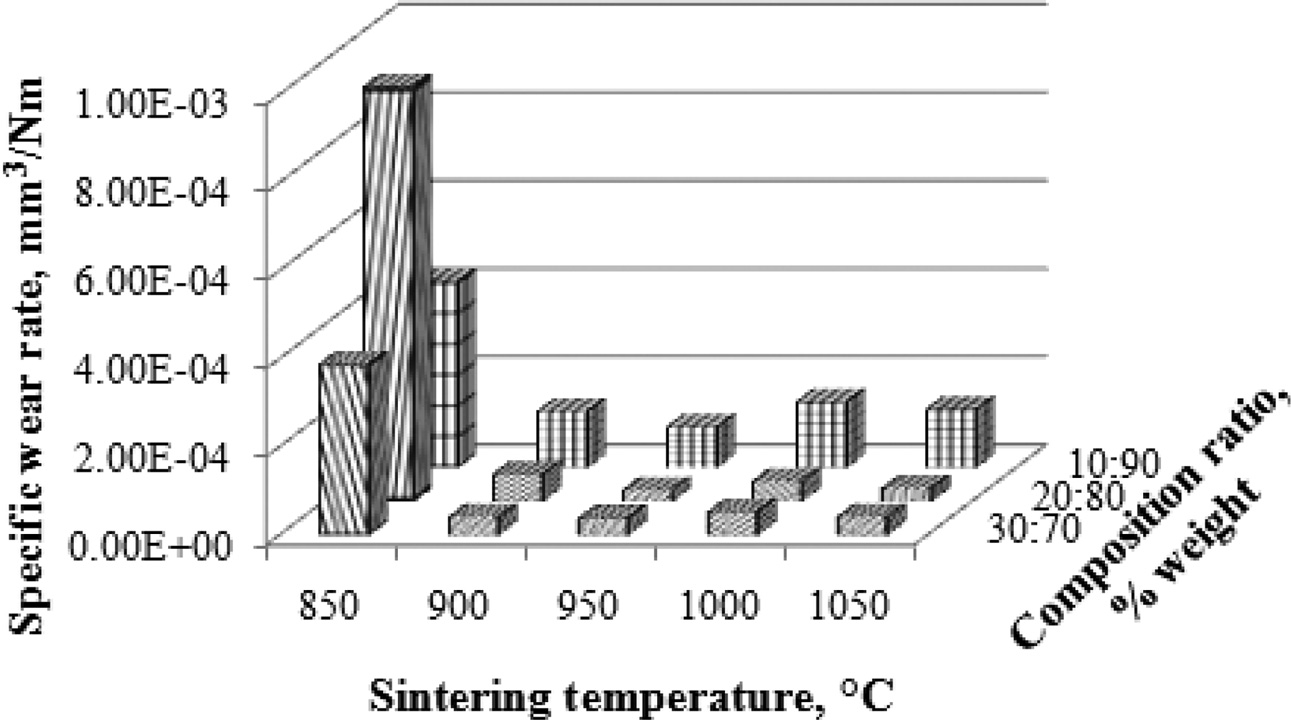
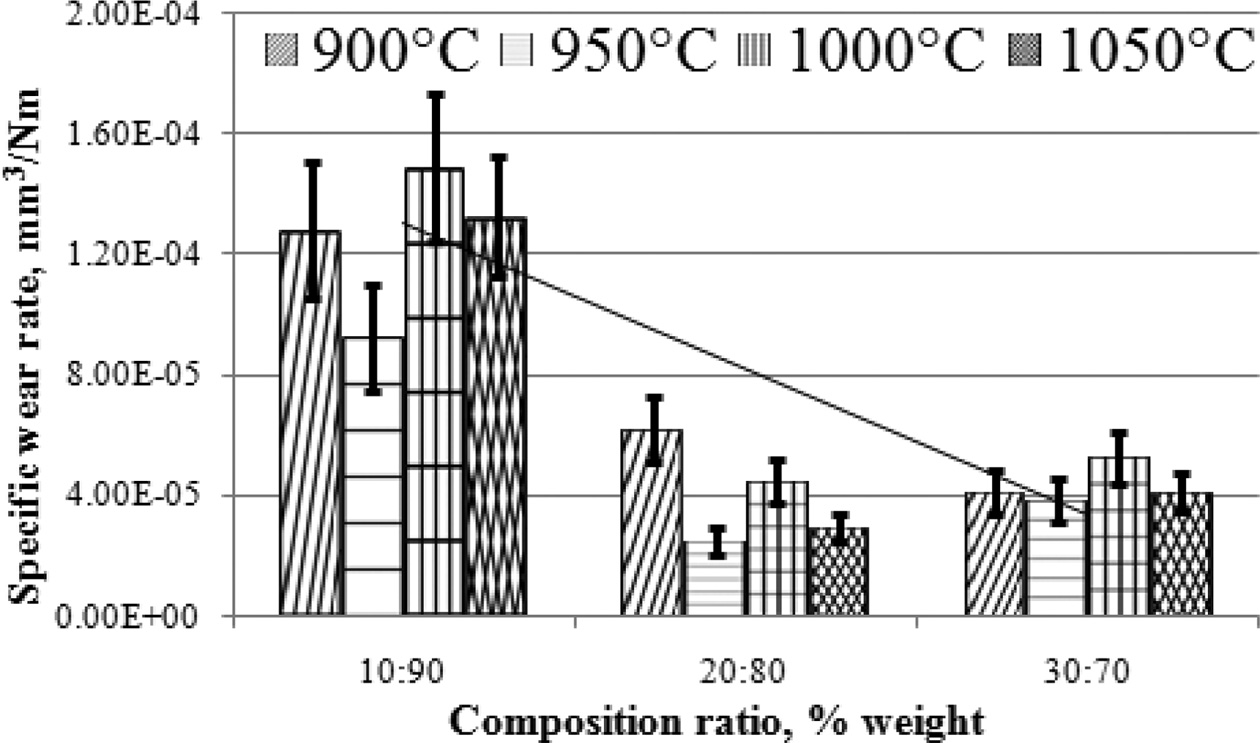
Wear rate testing is carried out with a disc wear tester machine, by measuring wear depth, wear trace length, wear trace width, while load, rotational speed, and distance traveled are constant. The measured wear rate is a specific wear rate, calculated by equation (3). The purpose of carbon ceramic composite wear rate testing is to determine the wear resistance value of carbon ceramic composites. The higher the sintering temperature reduces the composite wear rate. In addition, the higher the carbon fibers content of coconut fiber, the lower the composite wear rate. This proves that carbon ceramic composites with a composition ratio of 30:70 and higher sintering temperatures, more friction resistant, carbon ceramic composites are getting harder. The lowest value of specific wear rate is shown by carbon ceramic composites with a composition ratio of 20:80, at sintering temperatures of 950 ℃, with a wear rate of 0.000025033162 [mm3/Nm]. This composite has high wear resistance, at a load of one [N] and a distance of one [m], the composite will wear out at 0.000025033162 [mm3]. The highest specific wear rate is produced by composites with a composition ratio of 20:80, with sintering temperatures of 850 ℃, with a wear rate of 0.000941903786 [mm3/Nm], as shown in Fig. 4.
The sintering process at 850 ℃, at all composition ratios results in a high wear rate, meaning that the carbon ceramic composite is brittle against friction loads. Thus, this process does not produce hard and wear-resistant carbon ceramic composites.
The higher the carbon powders content, the lower the composite wear rate. This also proves that carbon content can increase the hardness of carbon ceramic composites, as shown in Fig. 5.
|
Fig. 4 Specific wear rate vs sintering temperature vs composition ratio. |
|
Fig. 5 Specific wear rate vs composition ratio. |
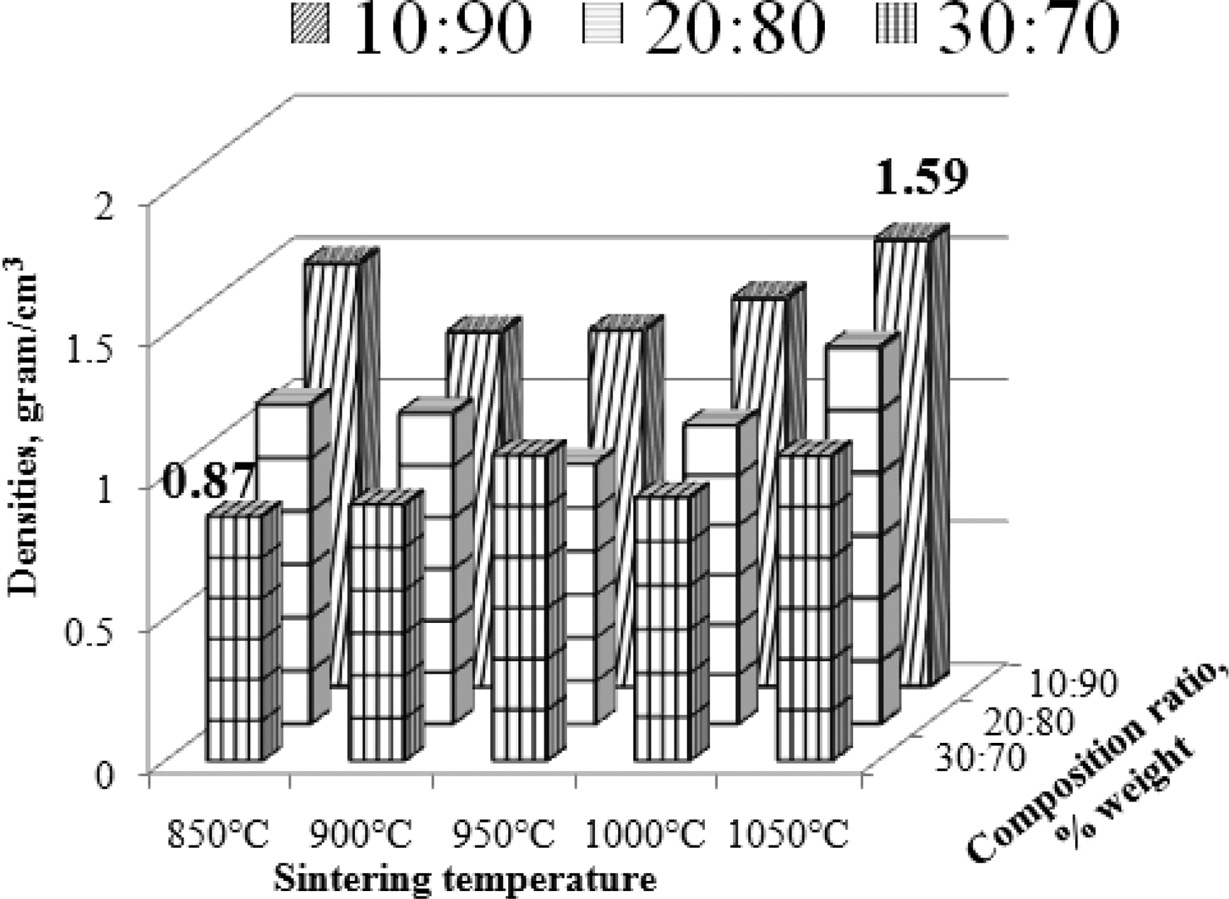
Density will affect the electrical conductivity and composite wear resistance. This is the reason why composite density testing is needed. Composites density were calculated by equation (4). The highest density is produced by carbon ceramic composites with a composition ratio of 10:90, with a sintering temperature of 1050 ℃, with a density value of 1.59 [g/cm3]. In general, an increase in sintering temperature can change the composite density. Composite density tends to be higher towards increasing sintering temperature, although the increase is not high.
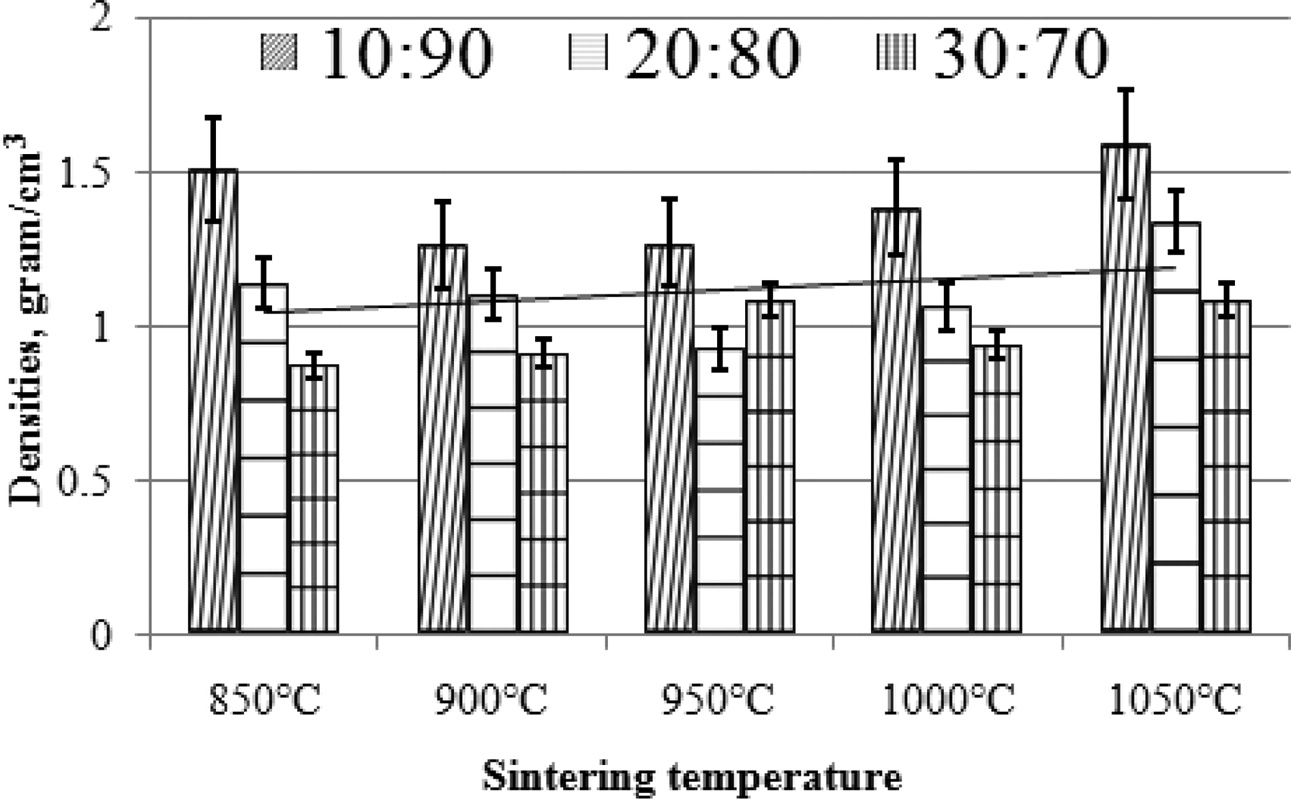
The lowest density is produced by the composition ratio of 30:70, at the sintering temperature of 850 ℃, which is 0.87 [g/cm3]. As shown in Fig. 6. Increasing the content of carbon powder has been shown to reduce composite density. This condition shows that the composite is getting lighter. The higher the carbon content, the lower the density of carbon ceramic composites, as shown in Fig. 7. This proves that consistently organoclay has a higher density than carbon. The coconut fiber carbon density test results are 0.45 [g/cm3], and the organoclay density before sintering process is 1.14 [g/cm3]. In comparison, other researchers also investigated the density of mullite-carbon ceramic composite [6, 22].
|
Fig. 6 Densities vs sintering temperature vs composition ratio. |
|
Fig. 7 Densities vs sintering temperature. |
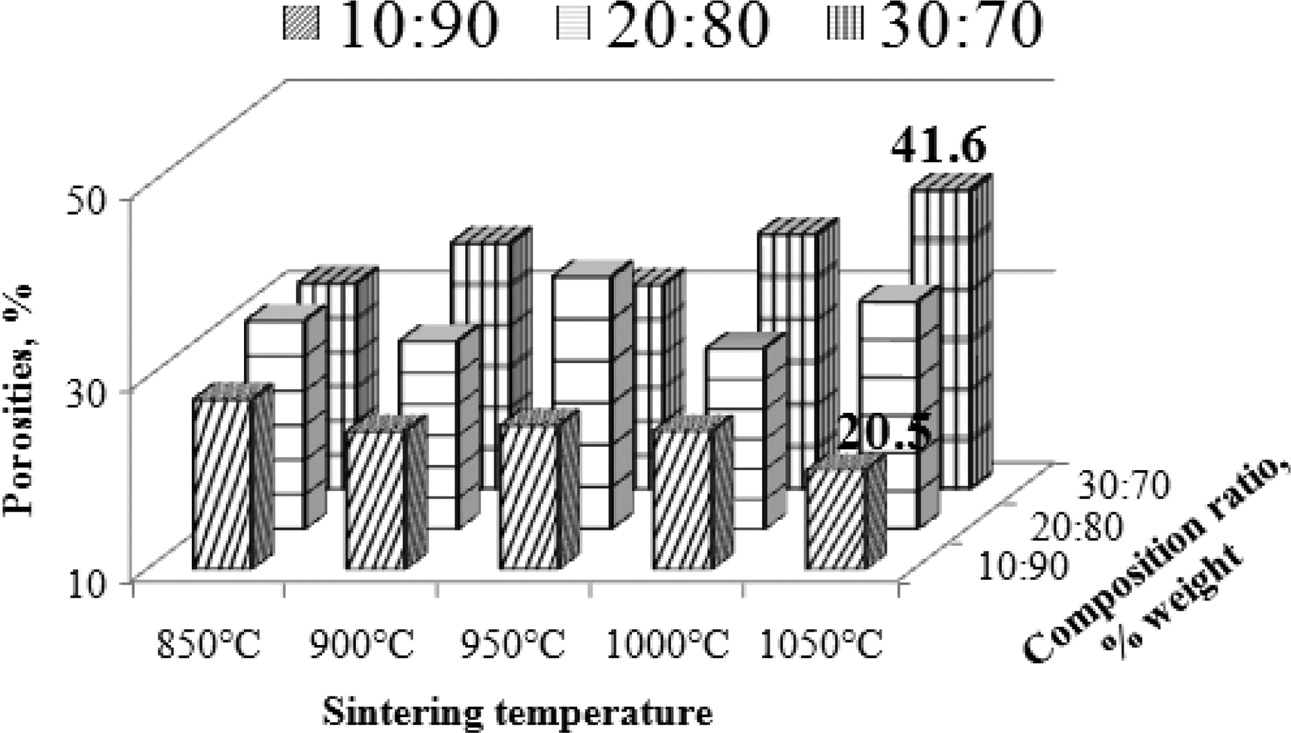
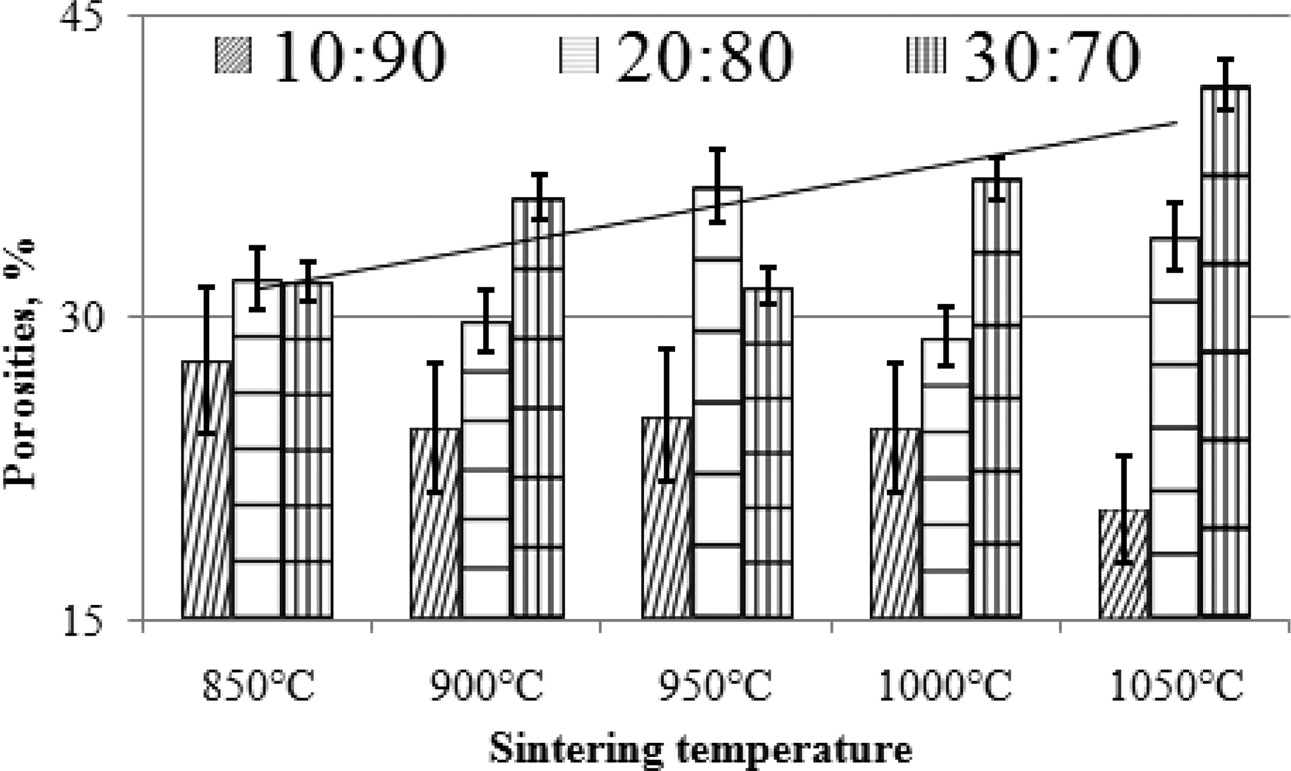
The effect of increasing pyrolysis-sintering temperature on carbon ceramic composites is not the same for each composition ratio. Carbon ceramic composites with a composition ratio of 10:90, when the sintering temperature of pyrolysis is increased from 850 ℃ to 1050 ℃, composite porosity tends to decrease, as shown in Fig. 8, whereas these composites tend to be denser, meaning the density increases, as shown in Fig. 9. Meanwhile, in carbon ceramic composites with a composition ratio of 20:80, the percentage of porosity tends to be relatively more stable, when the temperature is increased.
In contrast, carbon ceramic composites with a composition ratio of 30:70 produces porosity which tends to increase when the sintering temperature is increased. This shows an increase in water absorption, or more porosity. The increase in carbon content shown in the composition ratio tends to increase the percentage of porosity of carbon ceramic composites, as shown in Fig. 9.
This occurs in all temperature sintering variants. This shows that the carbon content increases water uptake in carbon ceramic composites. At the same time, it also shows that carbon is more porous than organoclay, which acts as a ceramic matrix. The porosity of mullite-carbon ceramic composite has also been investigated by other researchers [6].
|
Fig. 8 Porosities vs sintering temperature vs composition ratio. |
|
Fig. 9 Porosities vs sintering temperature. |
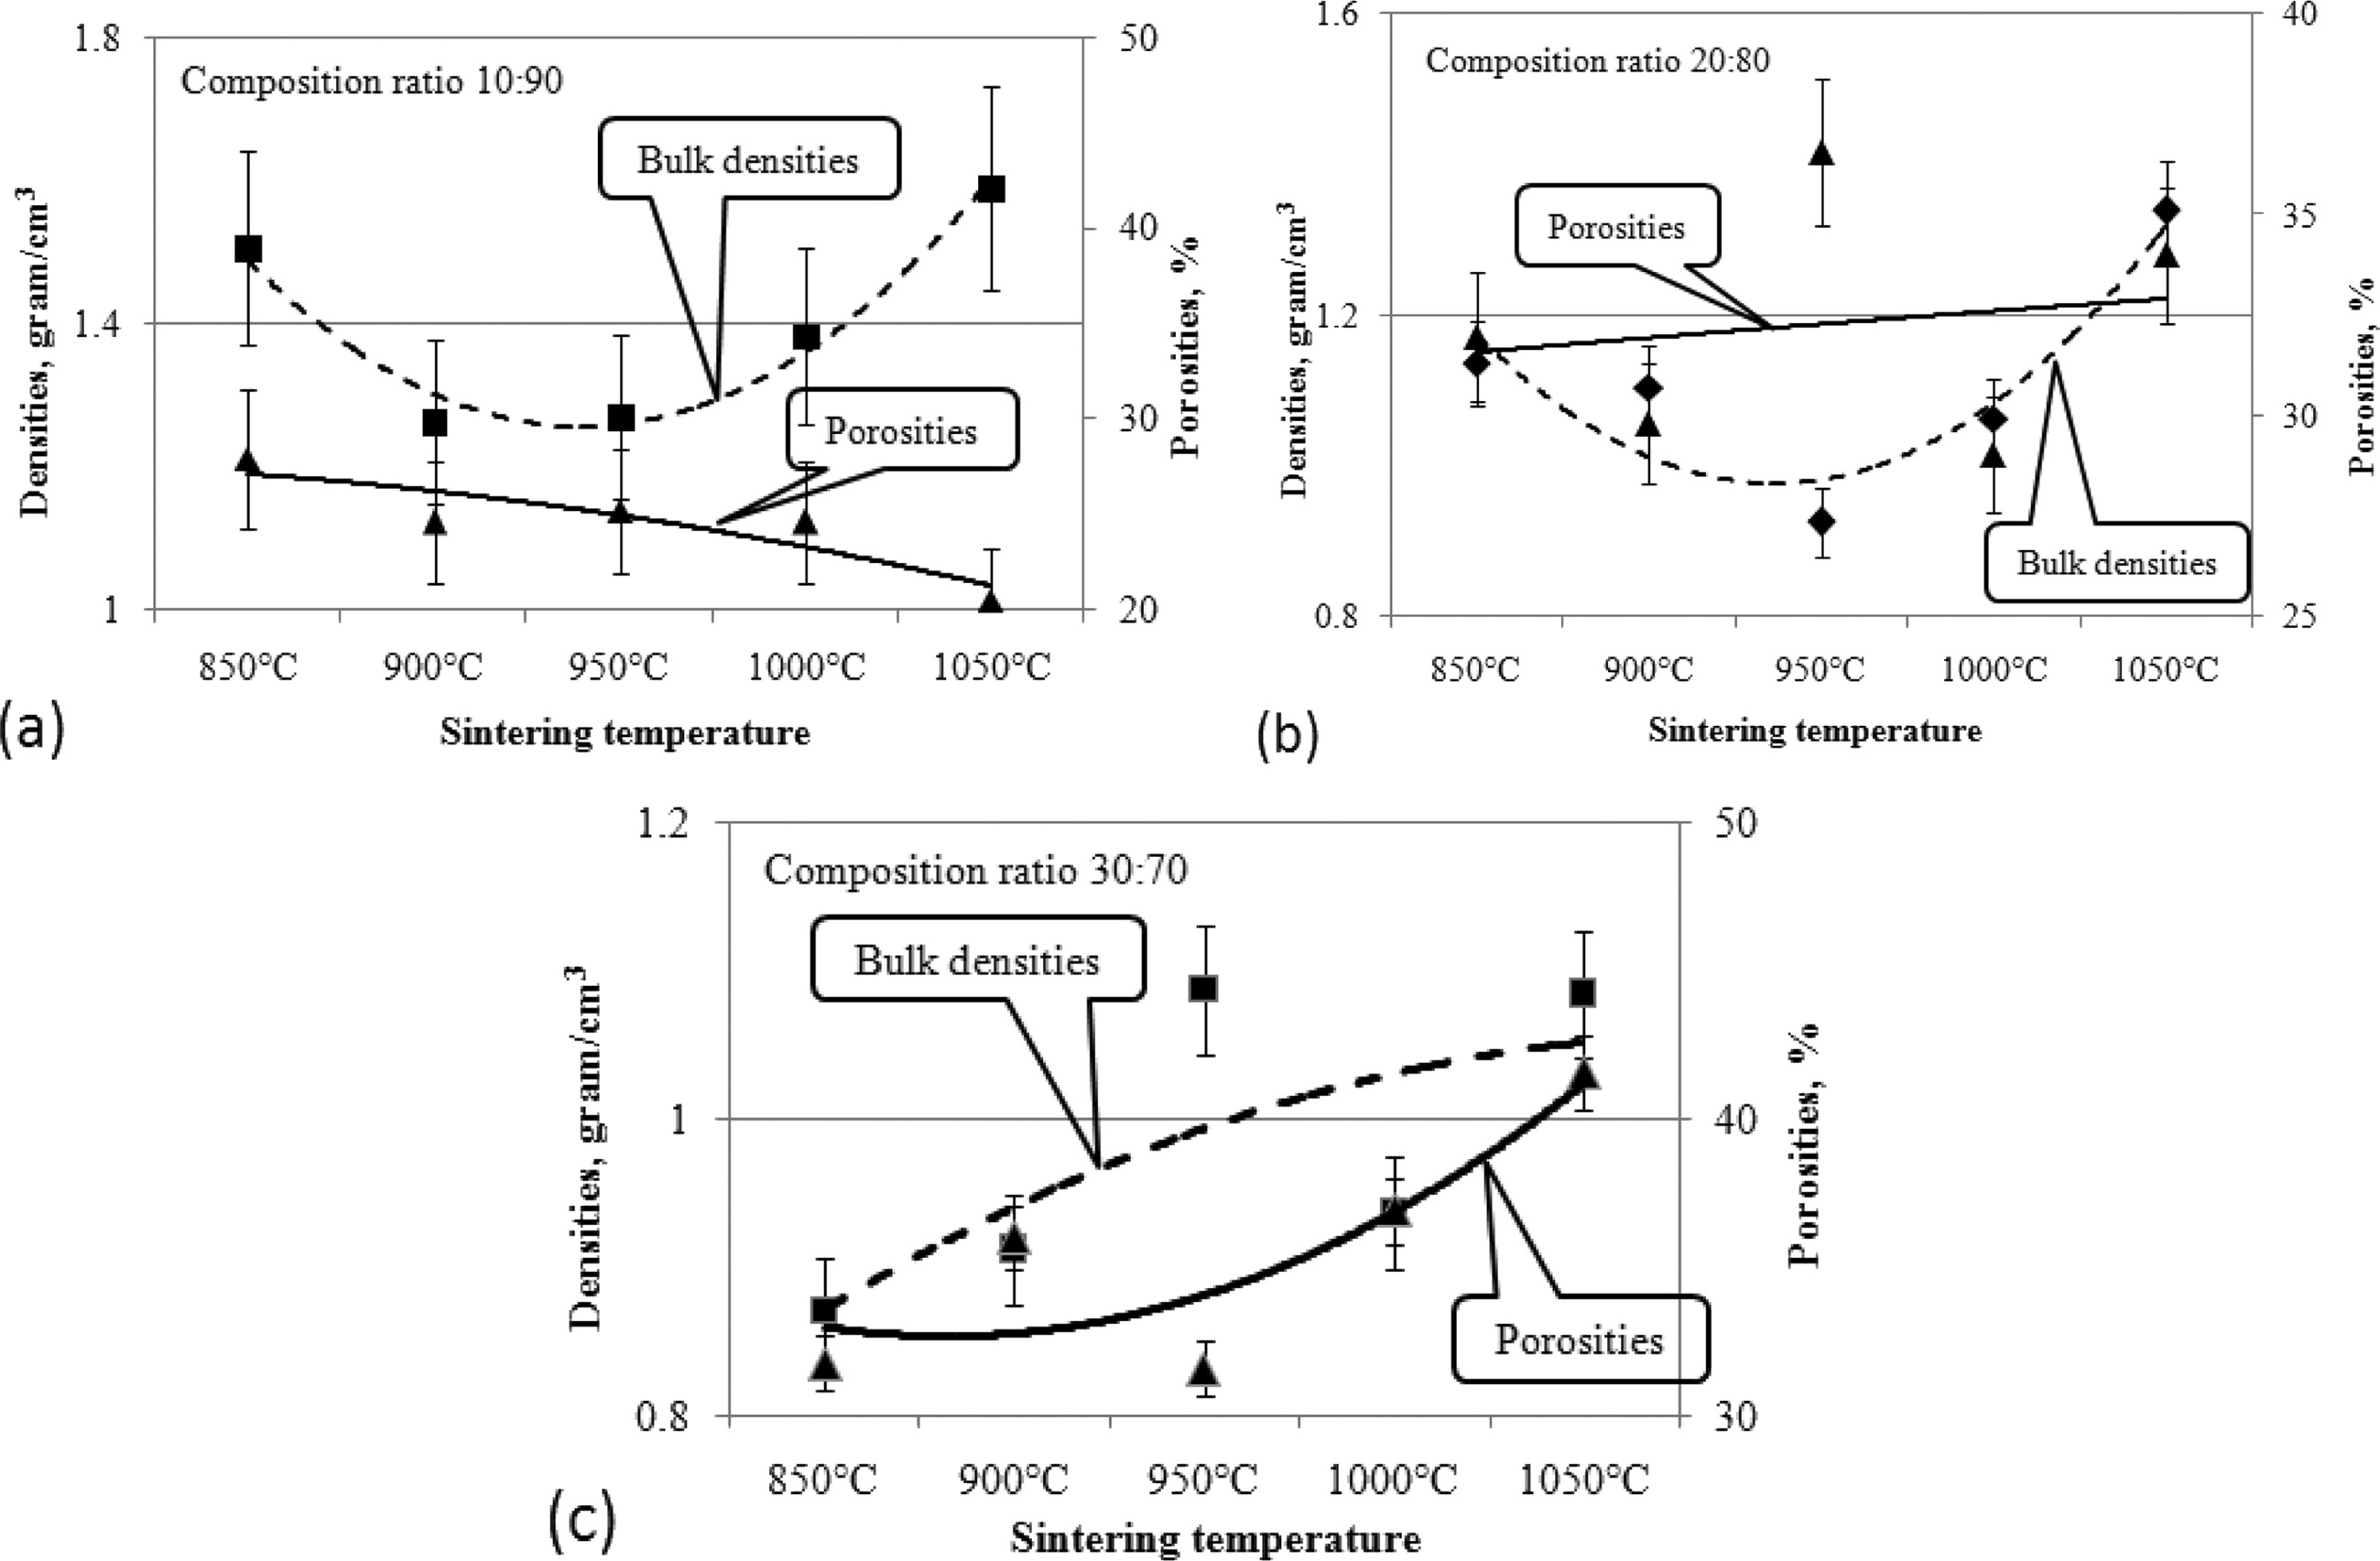
This section explains the relationship between porosity to composite density. As shown in Fig. 10. Analysis was carried out on all composition ratios; increasing temperature affected the physical properties of composite density and porosity. At a composition ratio of 10:90, when the sintering temperature is increased, the porosity decreases, and the density increases, as shown in Fig. 10(a). High clay content increases composite density when sintering temperature increases. In this process, this results in a heavier, denser composite. In composites with a composition ratio of 20:80, when the temperature is increased, porosity increases, followed by an increase in composite density. As shown in Fig. 10(b).
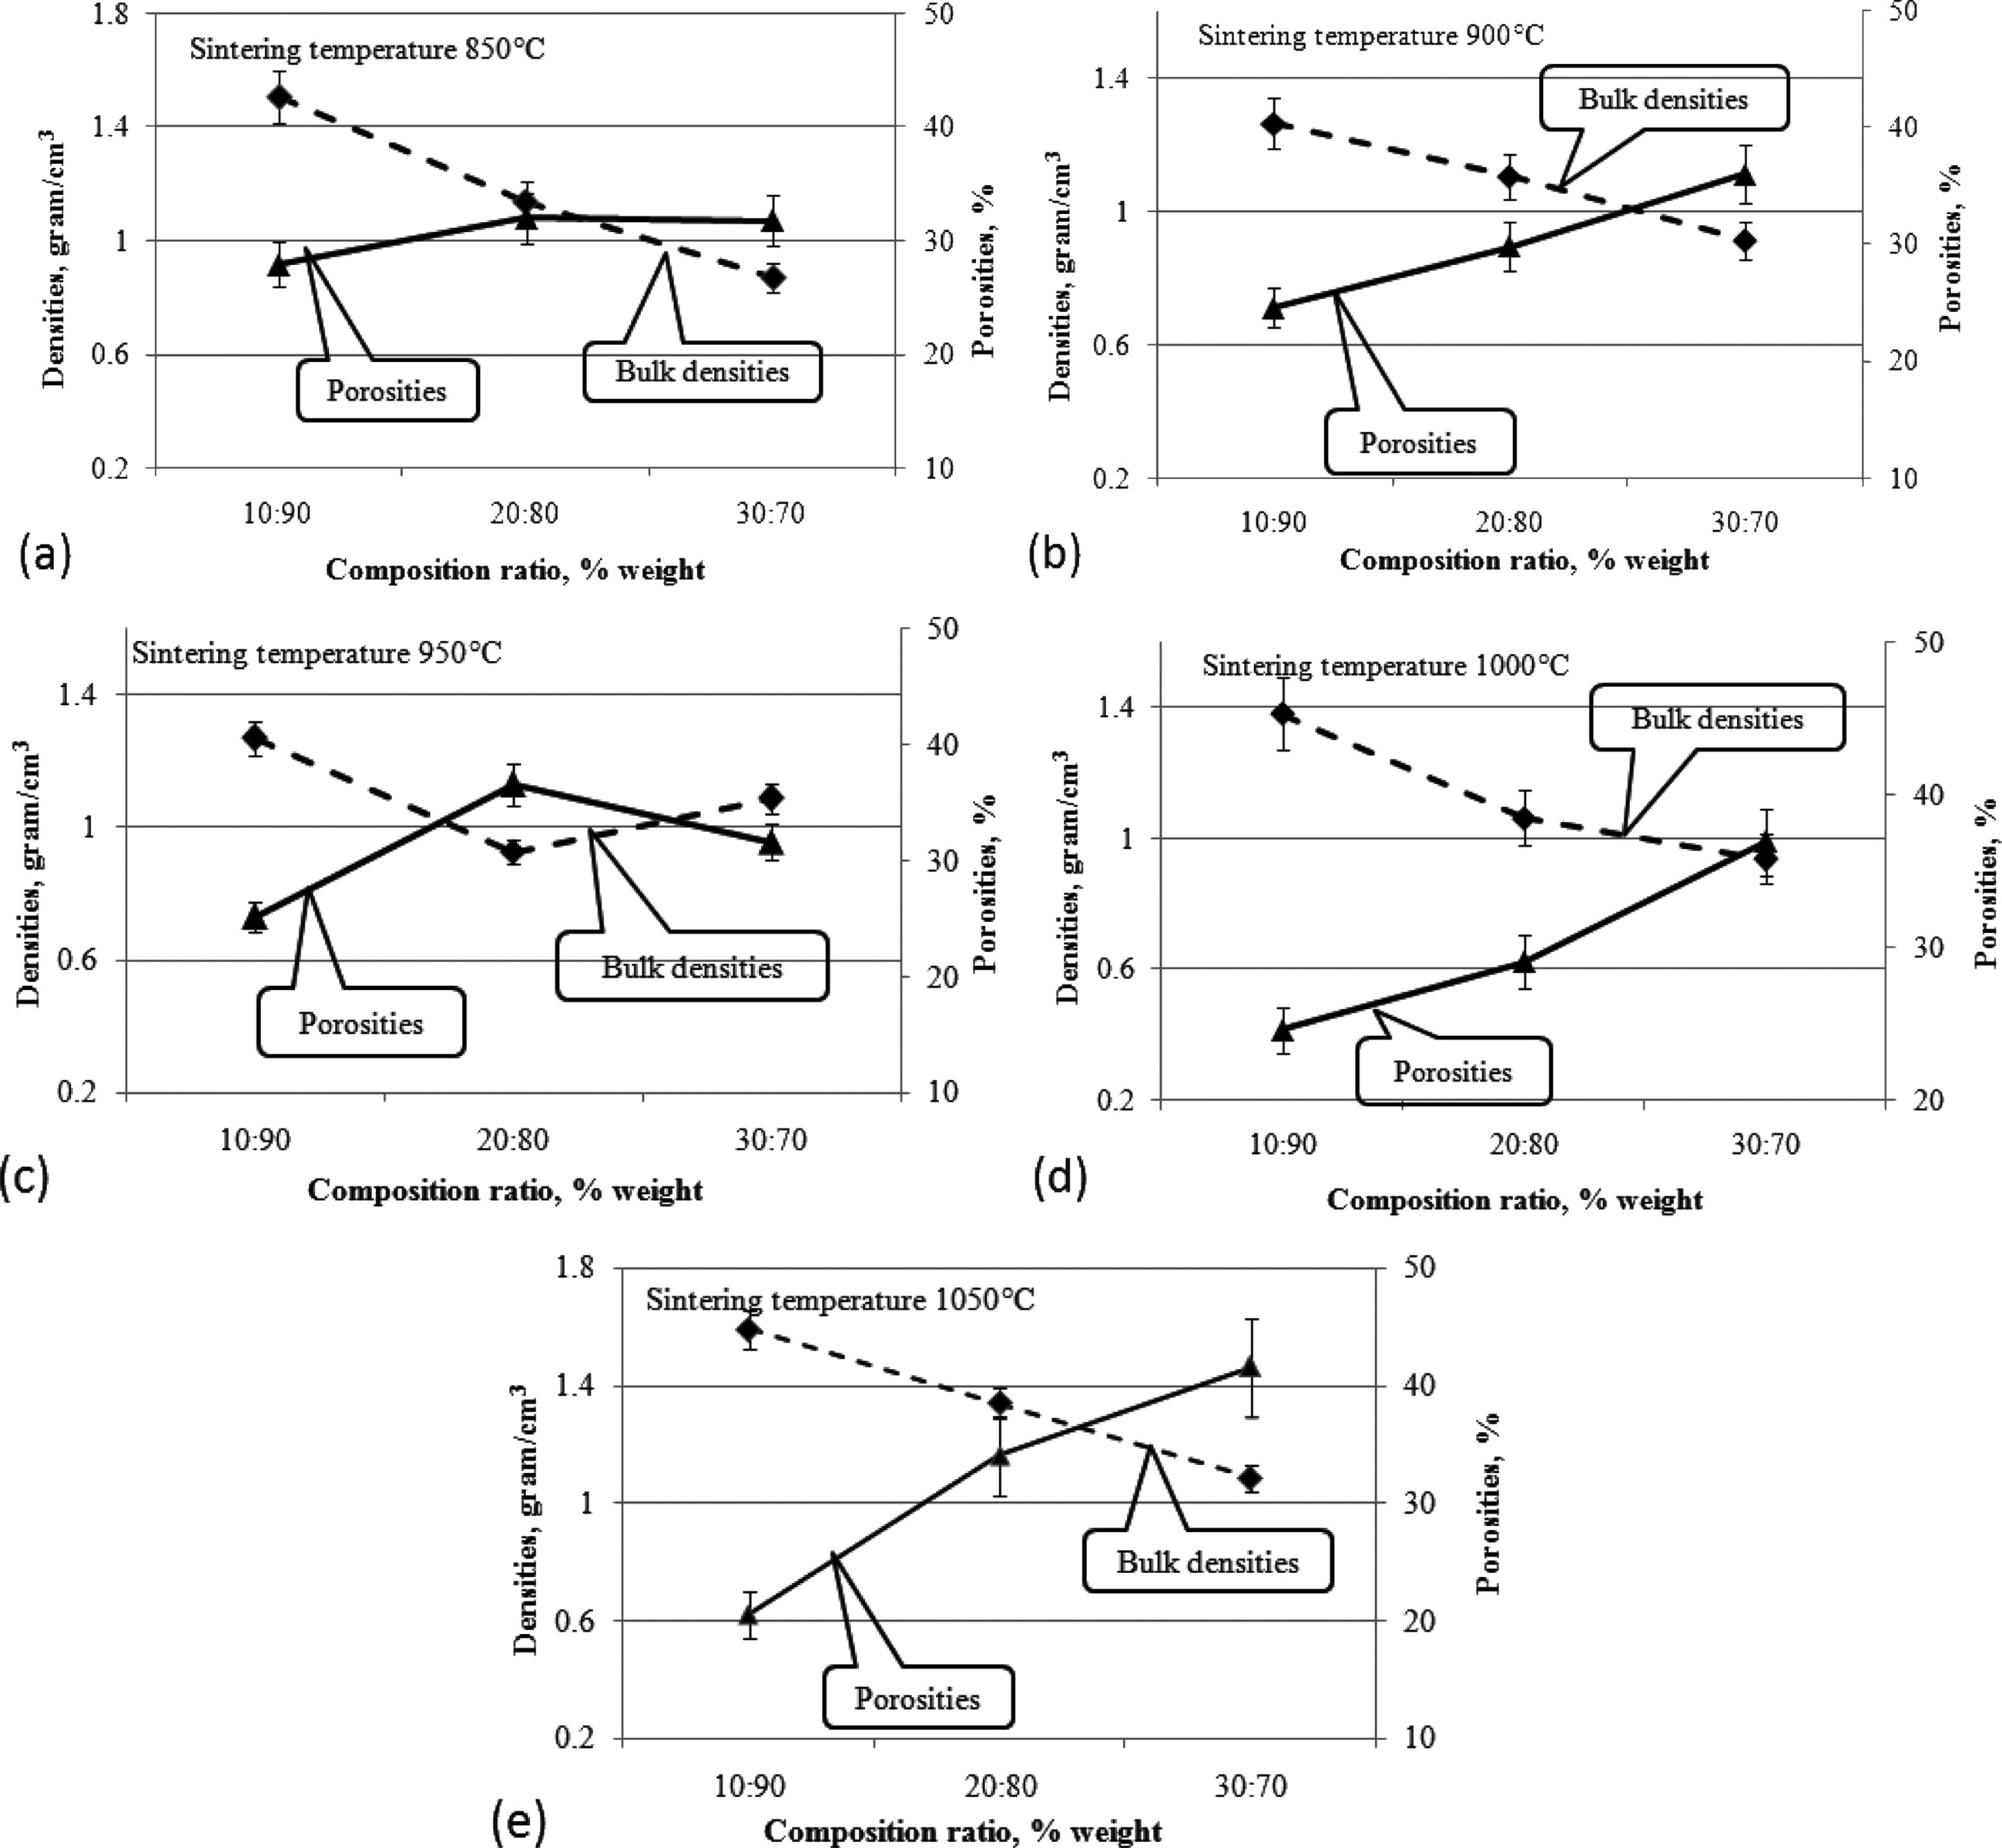
Composites with a composition ratio of 30:70 increase in porosity faster and higher than other composition ratios. Meanwhile, the density also increases, when the sintering temperature is increased, as shown in Fig. 10(c). Increases in density and porosity occur polynomially, and occur at all composition ratios, when the sintering temperature is increased. In general, composite density decreases when the composition ratio shows an enhanced carbon content, and the clay content is lowered. This results in increased porosity, as shown in Fig. 11(a)-(e). Increased carbon content will increase the cavities formed in ceramic composites, and conversely make ceramic composites lighter. As a comparison, it was shown in a 2014 study by other researchers [8, 28, 30].
|
Fig. 10 Relationship of densities to porosities based on sintering temperature. |
|
Fig. 11 Relationship of densities to porosities based on composition ratio. |
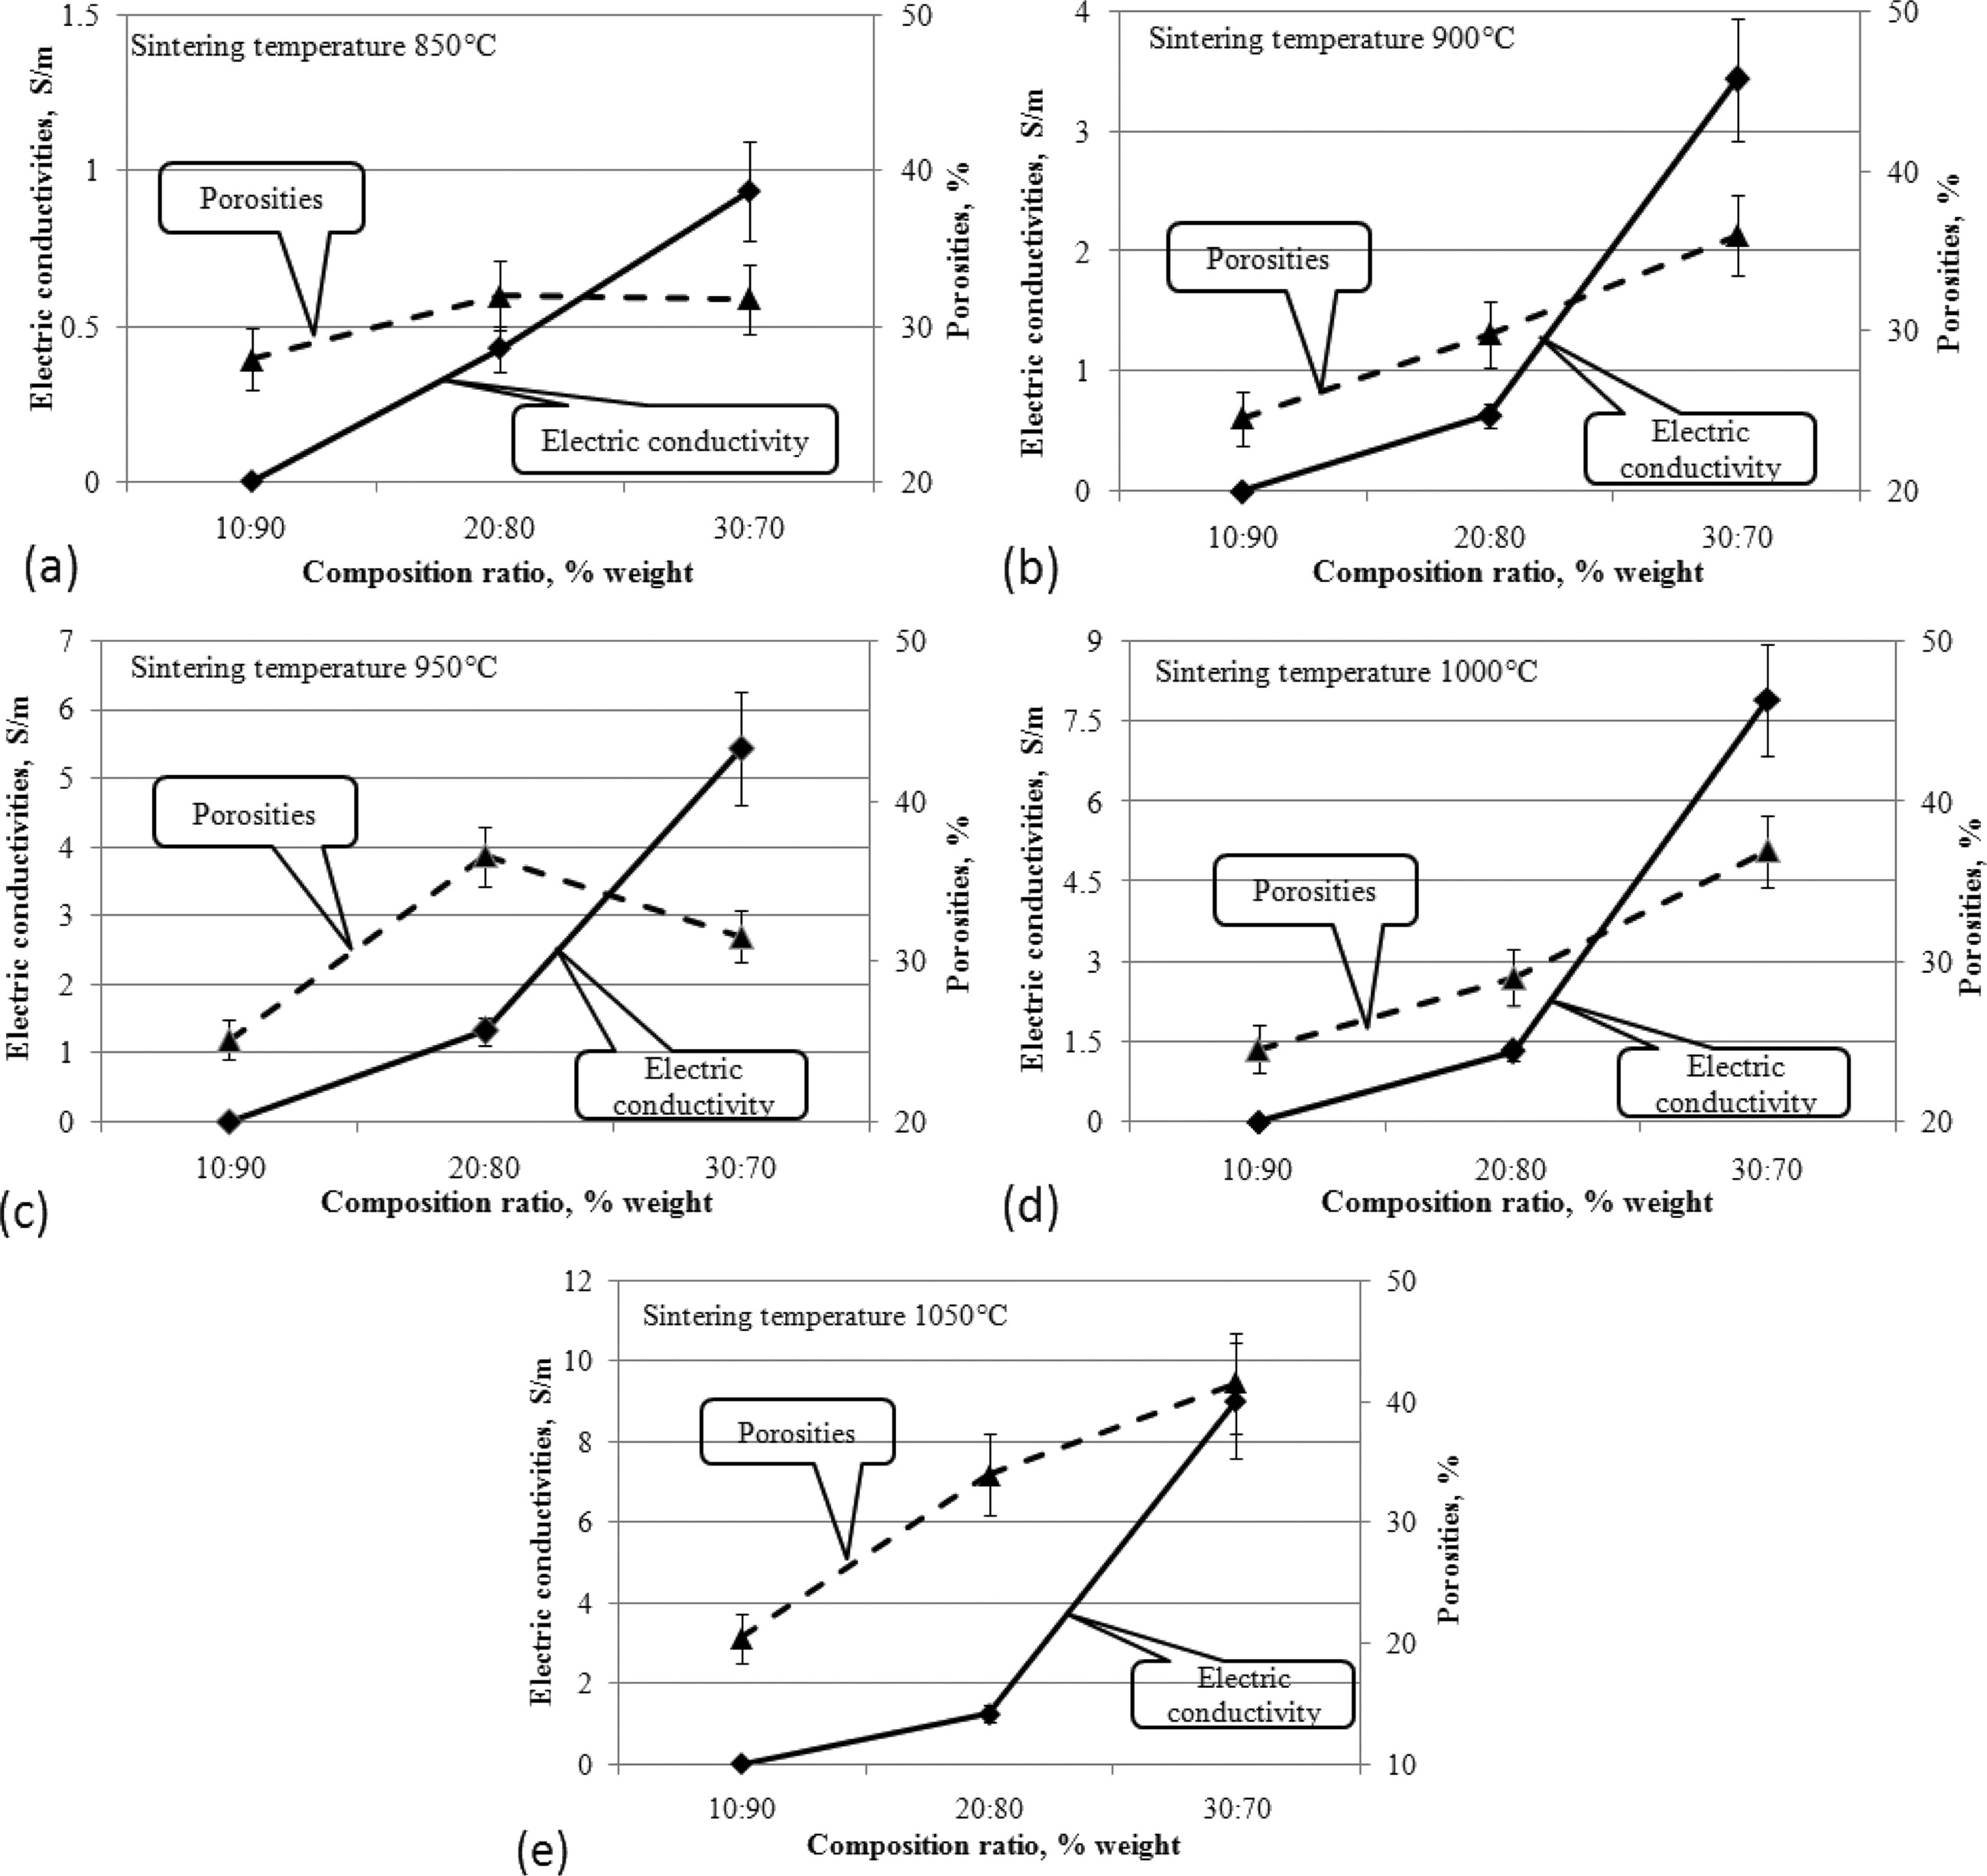
Increased carbon content in ceramic composites has increased composite porosity, but also increases the electrical conductivity of these composites. This occurs at sintering temperatures from 850 to 1050 ℃. Increased porosity does not inhibit electrical flow in general. This is shown in Fig. 12(a)-(e).
This fact shows that the carbon content increases porosity, meaning that the number of cavities increases, so that it decreases the density and makes the composite lighter, but it can still increase the electrical conductivity of carbon ceramic composites. Investigation of the relationship between electrical conductivity and porosity was also carried out by other researchers, as shown in the reference article [28].
|
Fig. 12 Relationship of electric conductivity to porosities based on composition ratio. |
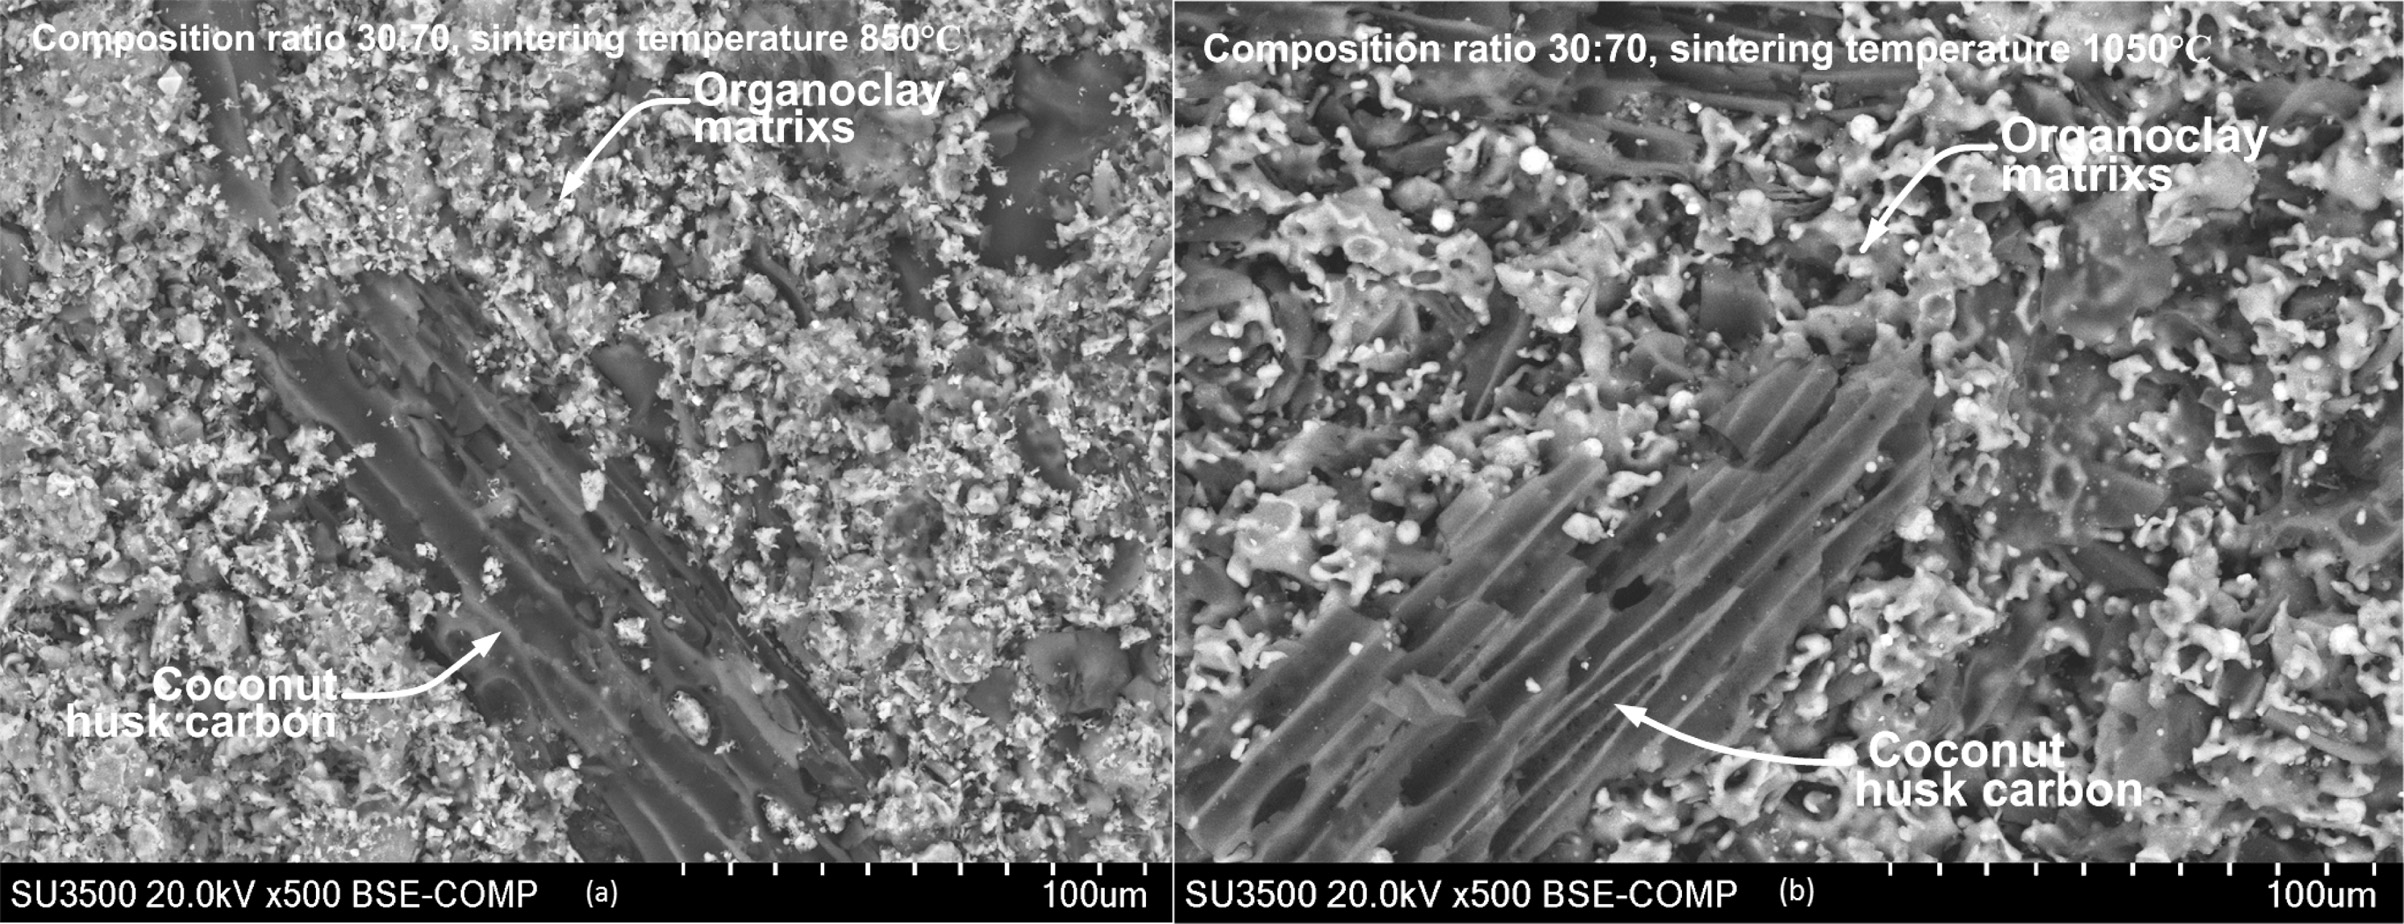
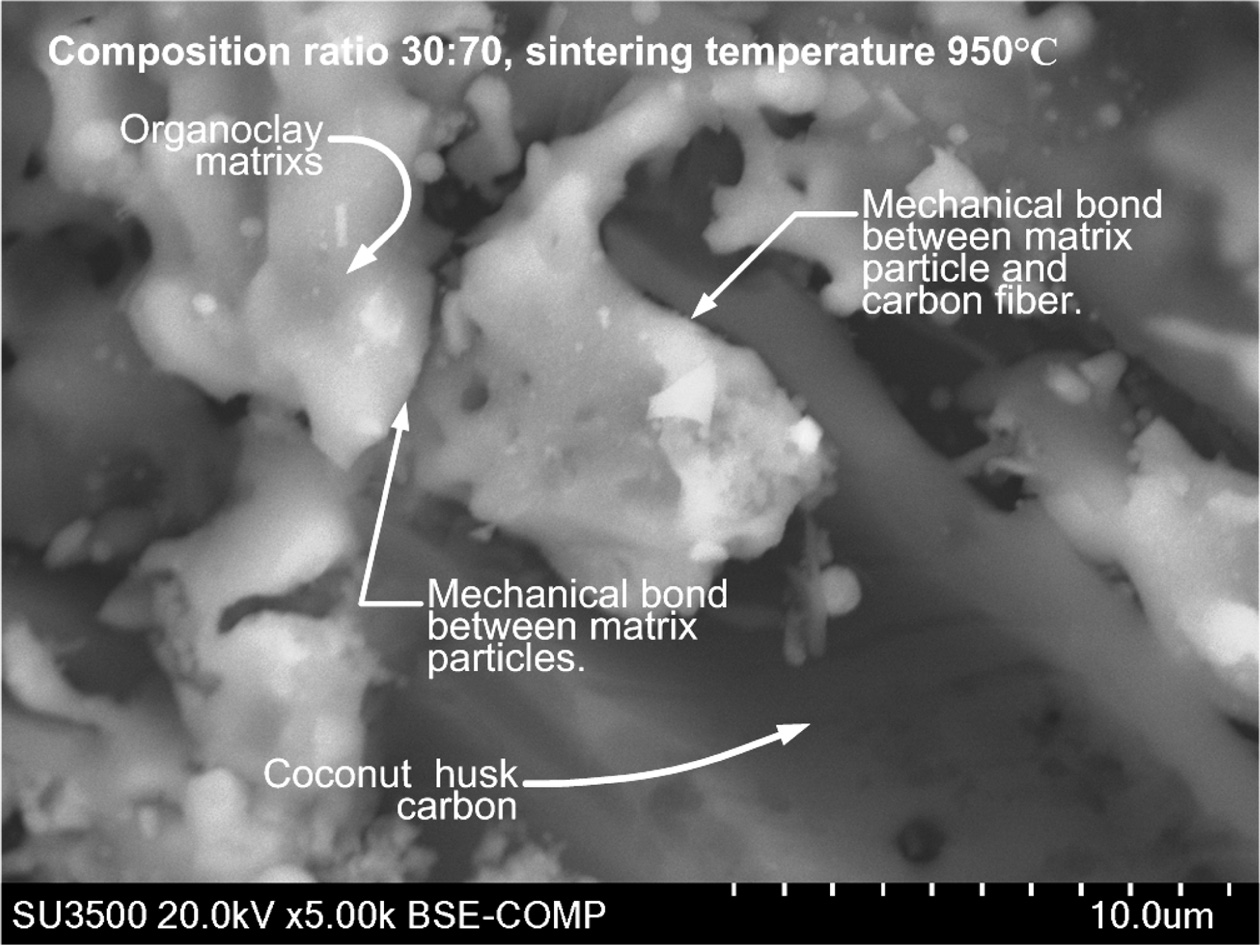
The test was carried out by scanning electron microscopic Hitachi SU 3500. The purpose of this test was to look at the morphological state of carbon ceramic composites. To see the possibility of cavity formation in the composite and interface between organoclay and carbon powder. The cavities formed in the composite will weaken the electrical conductivity and resistance of the composite wear rate. Micro photographs of microscopic scaning electron testing cannot distinguish morphology based on the composition ratio, and based on sintering temperature. Fig. 13(a) with a magnification of 500 × shows the morphology of carbon and ceramics from organoclay, this is indicated by the morphology of carbon ceramic composites with a composition ratio of 30:70% weight, 200 bar compaction and sintering temperature of 850 ℃. The appearance of coconut fiber carbon is seen in longitudinal black in the form of elongated fibers. While the appearance of the ceramic matrix is in the form of irregular granules, which surround and bind to carbon. The same is shown in Fig. 13(b); this image is the morphology of carbon ceramic composites with a composition ratio of carbon and organoclay 30:70% weight, a sintering temperature of 1050 ℃. In general, based on morphology, the binding appearance of the ceramic matrix to carbon is a mechanical bond, this is formed because the organoclay geometry and carbon ceramic particles are irregular, so that every gap, contour, cavity and basin is filled, and interconnects and locks. This is shown in Fig. 14, with a magnification of 5000 ×. This image is the morphology of carbon ceramic composites with a composition ratio of 30:70, sintering temperature of 950 ℃.
Based on the shape and dimensions of morphology, the outline shows macroporous, because the size of the cavity looks larger than μm75.
|
Fig. 13 Morphology of carbon ceramic composite 30:70, 850 ℃ dan 1050 ℃. |
|
Fig. 14 Morphology of mechanical bonding of carbon ceramic composite 30:70, 950 ℃. |
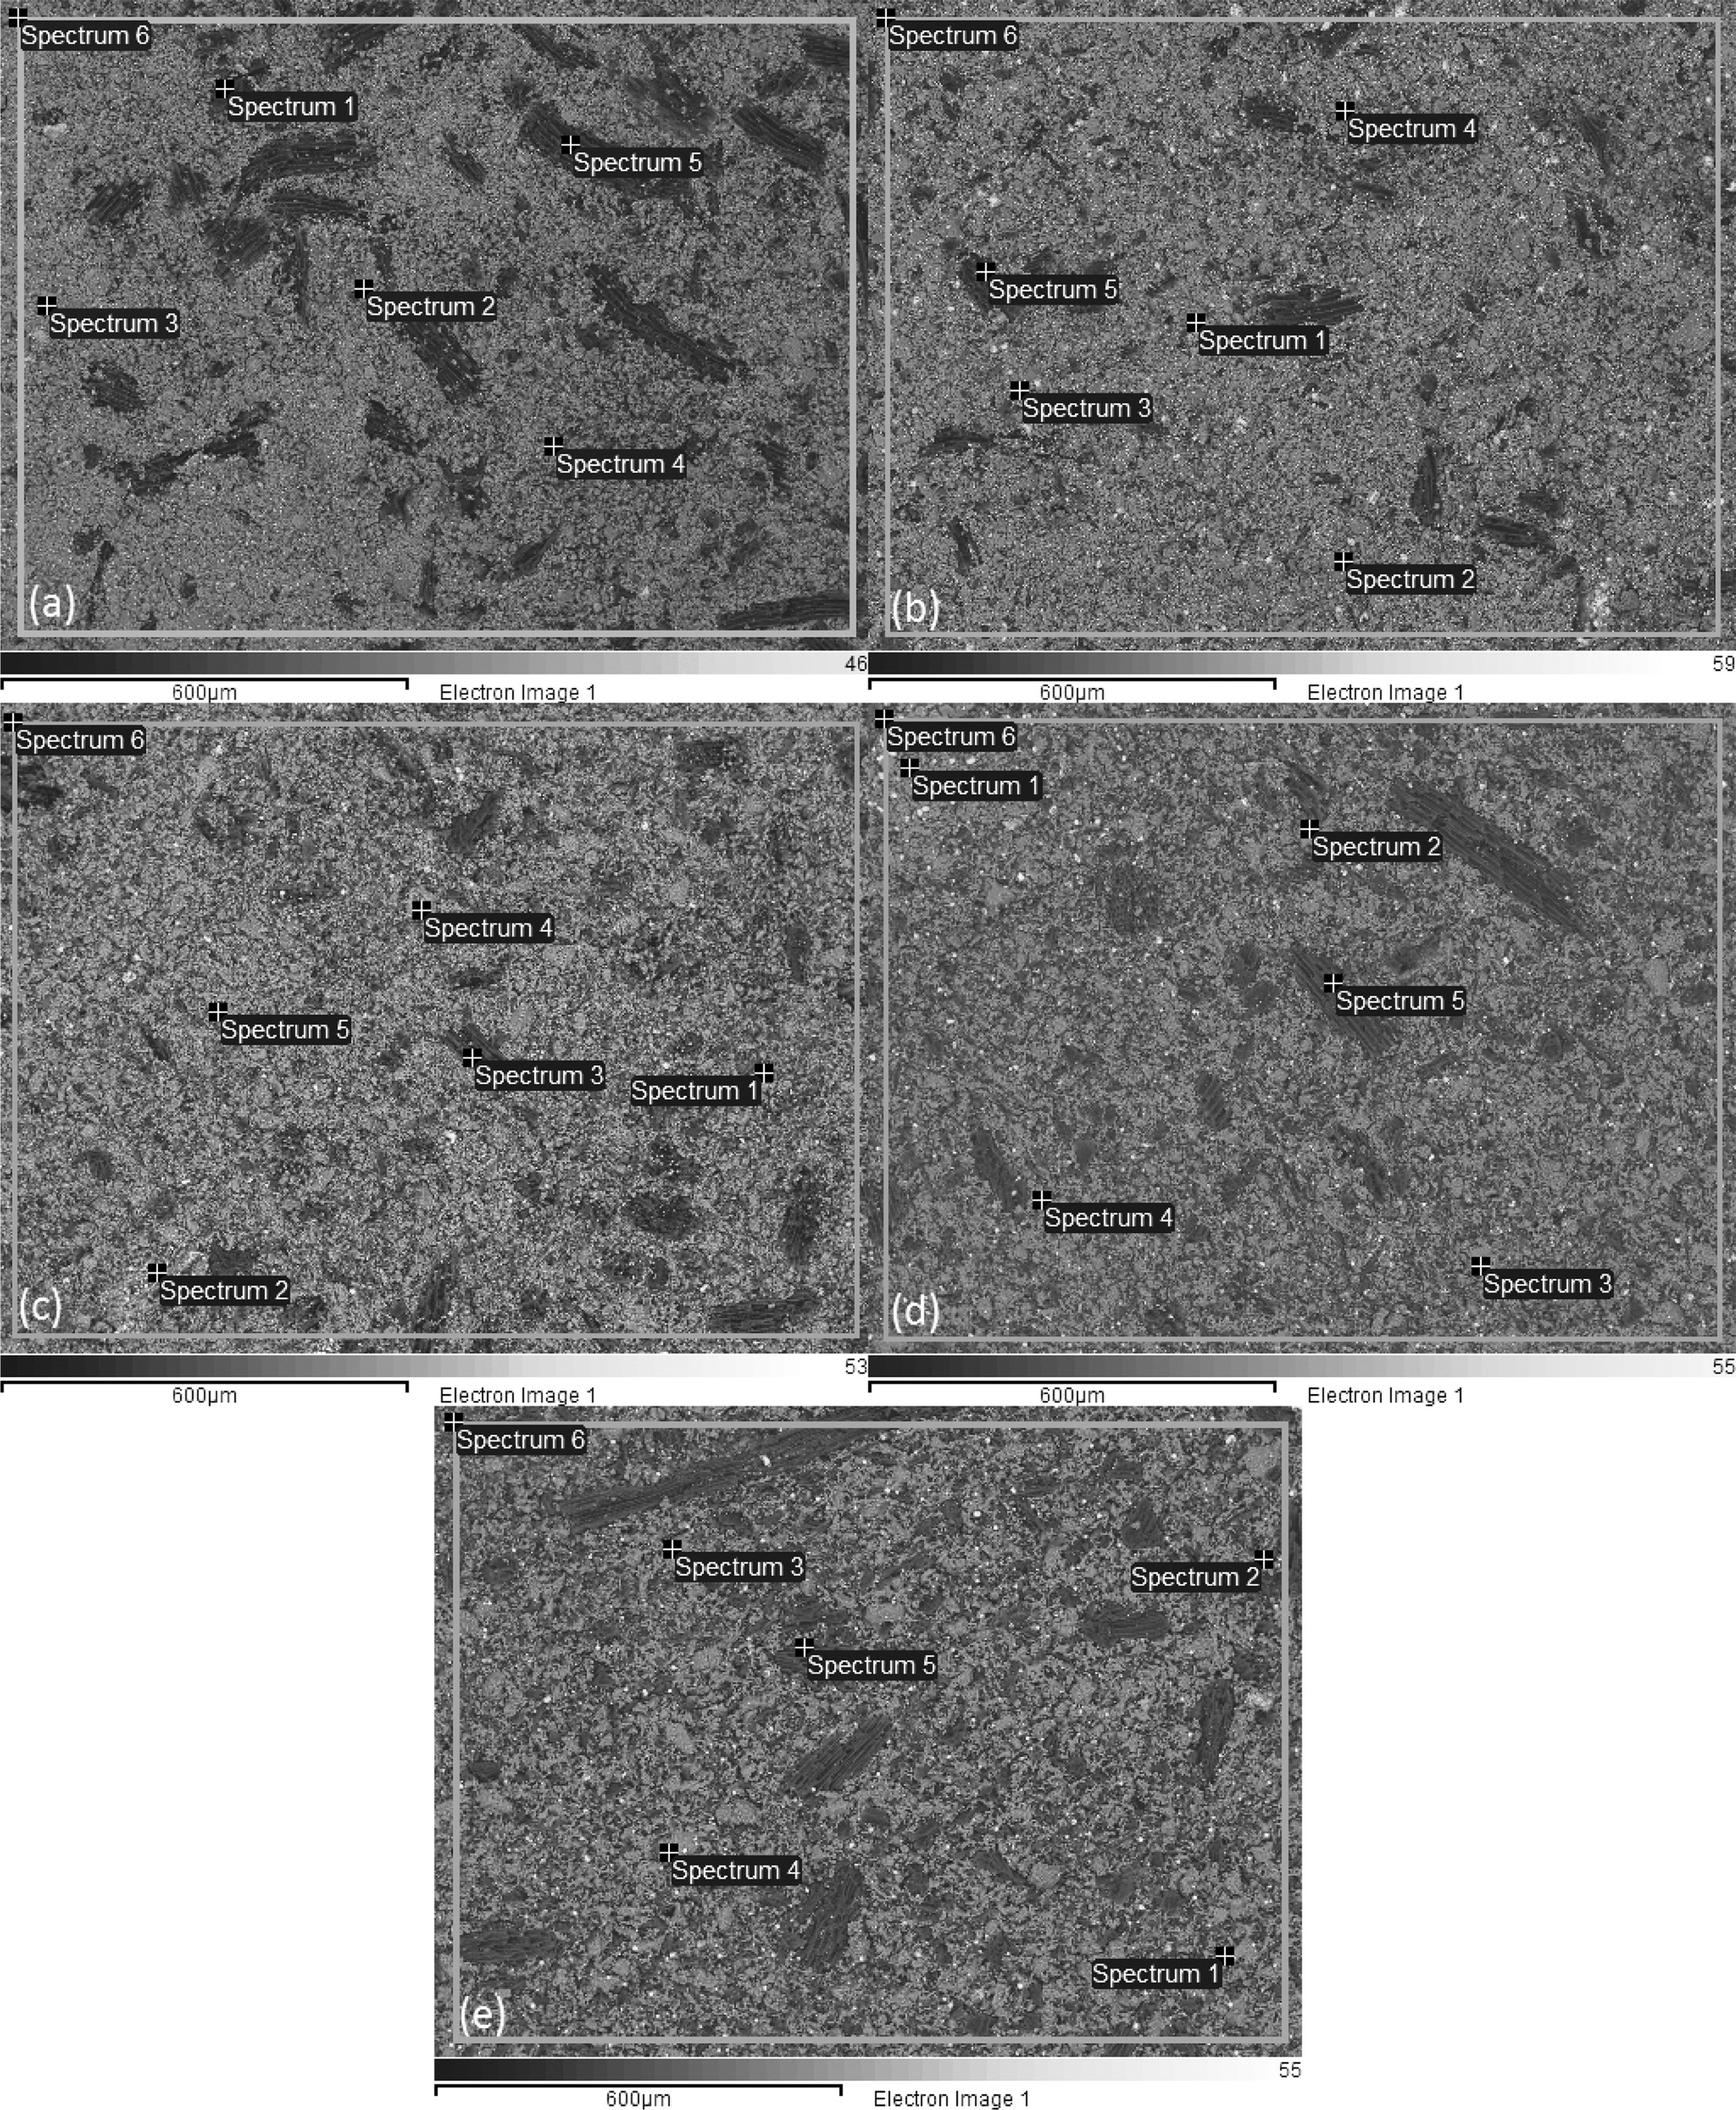
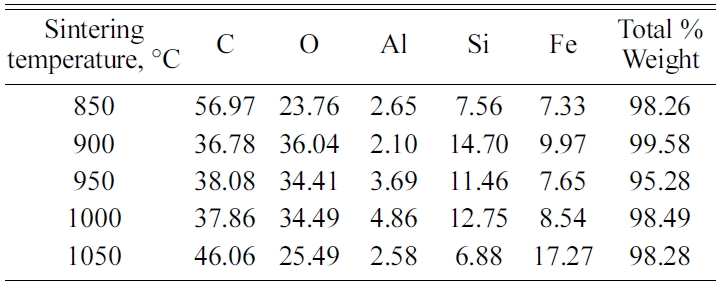
Elements contained in carbon ceramic composites are detected by testing EDX. Spectrum of EDX testing points for composites 30:70 and sintering 850℃ are shown in Fig. 15(a). The results of EDX testing show an uneven distribution of elements. Each spectrum point shows different percentage weights, and types of the elements, even though the specimens are tested in one bulk form of carbon ceramic composites. Results of the elemental weight percentage analysis are shown in Table 3. Point 1 of spectrum test in Fig. 15(a) shows the black area, and the dominant element of that point is carbon 90.28% weight, and oxygen 9.72% weight. Carbon and oxygen elements are relatively evenly distributed, spectrum testing shows that at all points there are carbon and oxygen elements, even though the weight percentages are not the same. Point 3 spectrum shows the distribution of Fe element as the highest, which is 30.86% weight, then 29.21% O. Meanwhile, at other spectrum points it is low, even 0% Fe, as shown in Table 3. Each spectrum test point shows the content of different elements, both types and percentage weights. Relatively even distribution and dominant elements are carbon and oxygen, at all test points there is a content of these two elements. Carbon ceramic composite elements with a composition ratio of 30:70% weight, and 900 ℃ sintering temperature shown in Fig. 15(b), also show the same thing. The weight value percentage of each element is shown in Table 4. Point 5 of the spectrum test, in Fig. 15(b), shows a carbon content of 82% weight, according to the point indicated by the dark black feature. Point 1 of the spectrum test shows the content of variations in the types of elements that are richer, at this point there are C, O, Al, Si, K, Ca, and Fe. While other spectrums test points, do not show the same content as point 1 spectrum test. Even in point 2 of the spectrum test, the highest element content was indicated by 46.37% O, then 28.26% Si. Point 4 of the spectrum test shows the amount of the element with the order of 42.52% O, then 36.66% Fe.
This shows that the distribution of elements contained in this carbon ceramic composite is uneven. The result of this uneven distribution of elements is the mechanical properties, physical properties, and electrical properties, which also will not be the same at each of these test points.
Carbon ceramic composite elements with sintering temperature of 950 ℃, in EDX testing also showed different distribution of element types and weight percentages at each spectrum testing point. The test spectrum point is shown in Fig. 15(c). Point 3 of the spectrum test shows a solid black feature; it shows high carbon content, namely 88.06% C, then followed by 7.16% O, and 4.78% Fe.
Meanwhile, the other spectrum points show different types and quantities of elements. As shown in Table 5. EDX testing of carbon ceramic composites with a sintering temperature of 1000℃ is shown in Fig. 15(d) and Table 6.
The highest carbon content is indicated by point 5 of spectrum test of 92.18% weight, and 7.82% weight is oxygen. At this point, there are only 2 elements, namely carbon and oxygen. Other elements, such as Na, Mg, Al, Si, K, and Fe are scattered in other spectrum points, unevenly. At one point of the test spectrum showed the highest content of the element is Fe, 49% weight, followed by the elements C 28.25% weight. At points 2, 3, 4 and 5 of the spectrum test do not show the presence of Fe elements.
Si elements are spread in almost all test spectrum points, except in point 5 of the spectrum test. The highest content of oxygen elements is shown in points 2, 3 and 4 of the spectrum test, sequentially at 56.11, 48.68, and 43.32% weights. Then followed by carbon elements, as the second largest element. Testing the distribution of elements from carbon ceramic composites with sintering temperatures of 1050 ℃ is shown in Fig. 15(e) and Table 7. The highest content for all spectrum points is the carbon element. The second largest content is oxygen, and this is found in all points of spectrum test. The highest carbon content is indicated by point 5 of spectrum test, amounting to 88.16% carbon weight. Elements Na and Mn are not present in carbon ceramic composites sintered to temperatures of 1050 ℃, but there are elements of Ca, in point 4 of the spectrum test. The values of element weights are shown in Table 7. This composite shows a unique thing. At point, 1 and 2 the spectrum test shows the highest element content is Fe, which is 57.88%, and 42.3% weight. At these points, the highest content is not carbon, as shown in composites with other sintering temperatures.
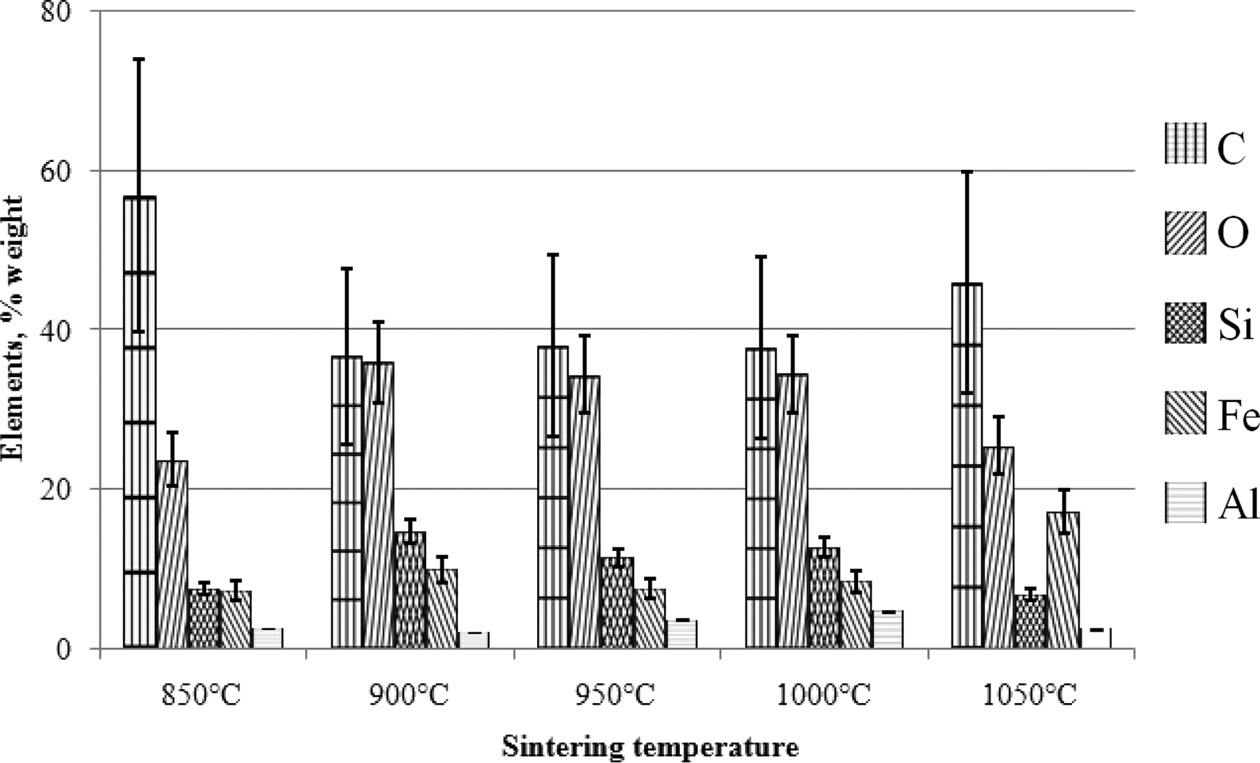
The main content of carbon ceramic composites with a composition ratio of 30:70% weight is shown in Fig. 16 and Table 8. The results shown are the average of spectrum testing points, so it can be said to be an element of the whole test specimen of carbon ceramic composites, while also providing information about the main content of the specimen. In sequence, the largest main content is elements C, O, Si, Fe, and Al. Except for composites with sintering temperature of 1050 ℃, with C, O, Fe, Si, and Al sequences. Based on the EDX test results, it is evident that the distribution of elements of carbon ceramic composites is uneven, and this occurs in all composition ratios, and sintering temperatures of carbon ceramic composites.
|
Fig. 15 Spectrum of EDX test for composite 30:70, 850 ℃. |
|
Fig. 16 Main content of the carbon ceramic composite, 30:70. |
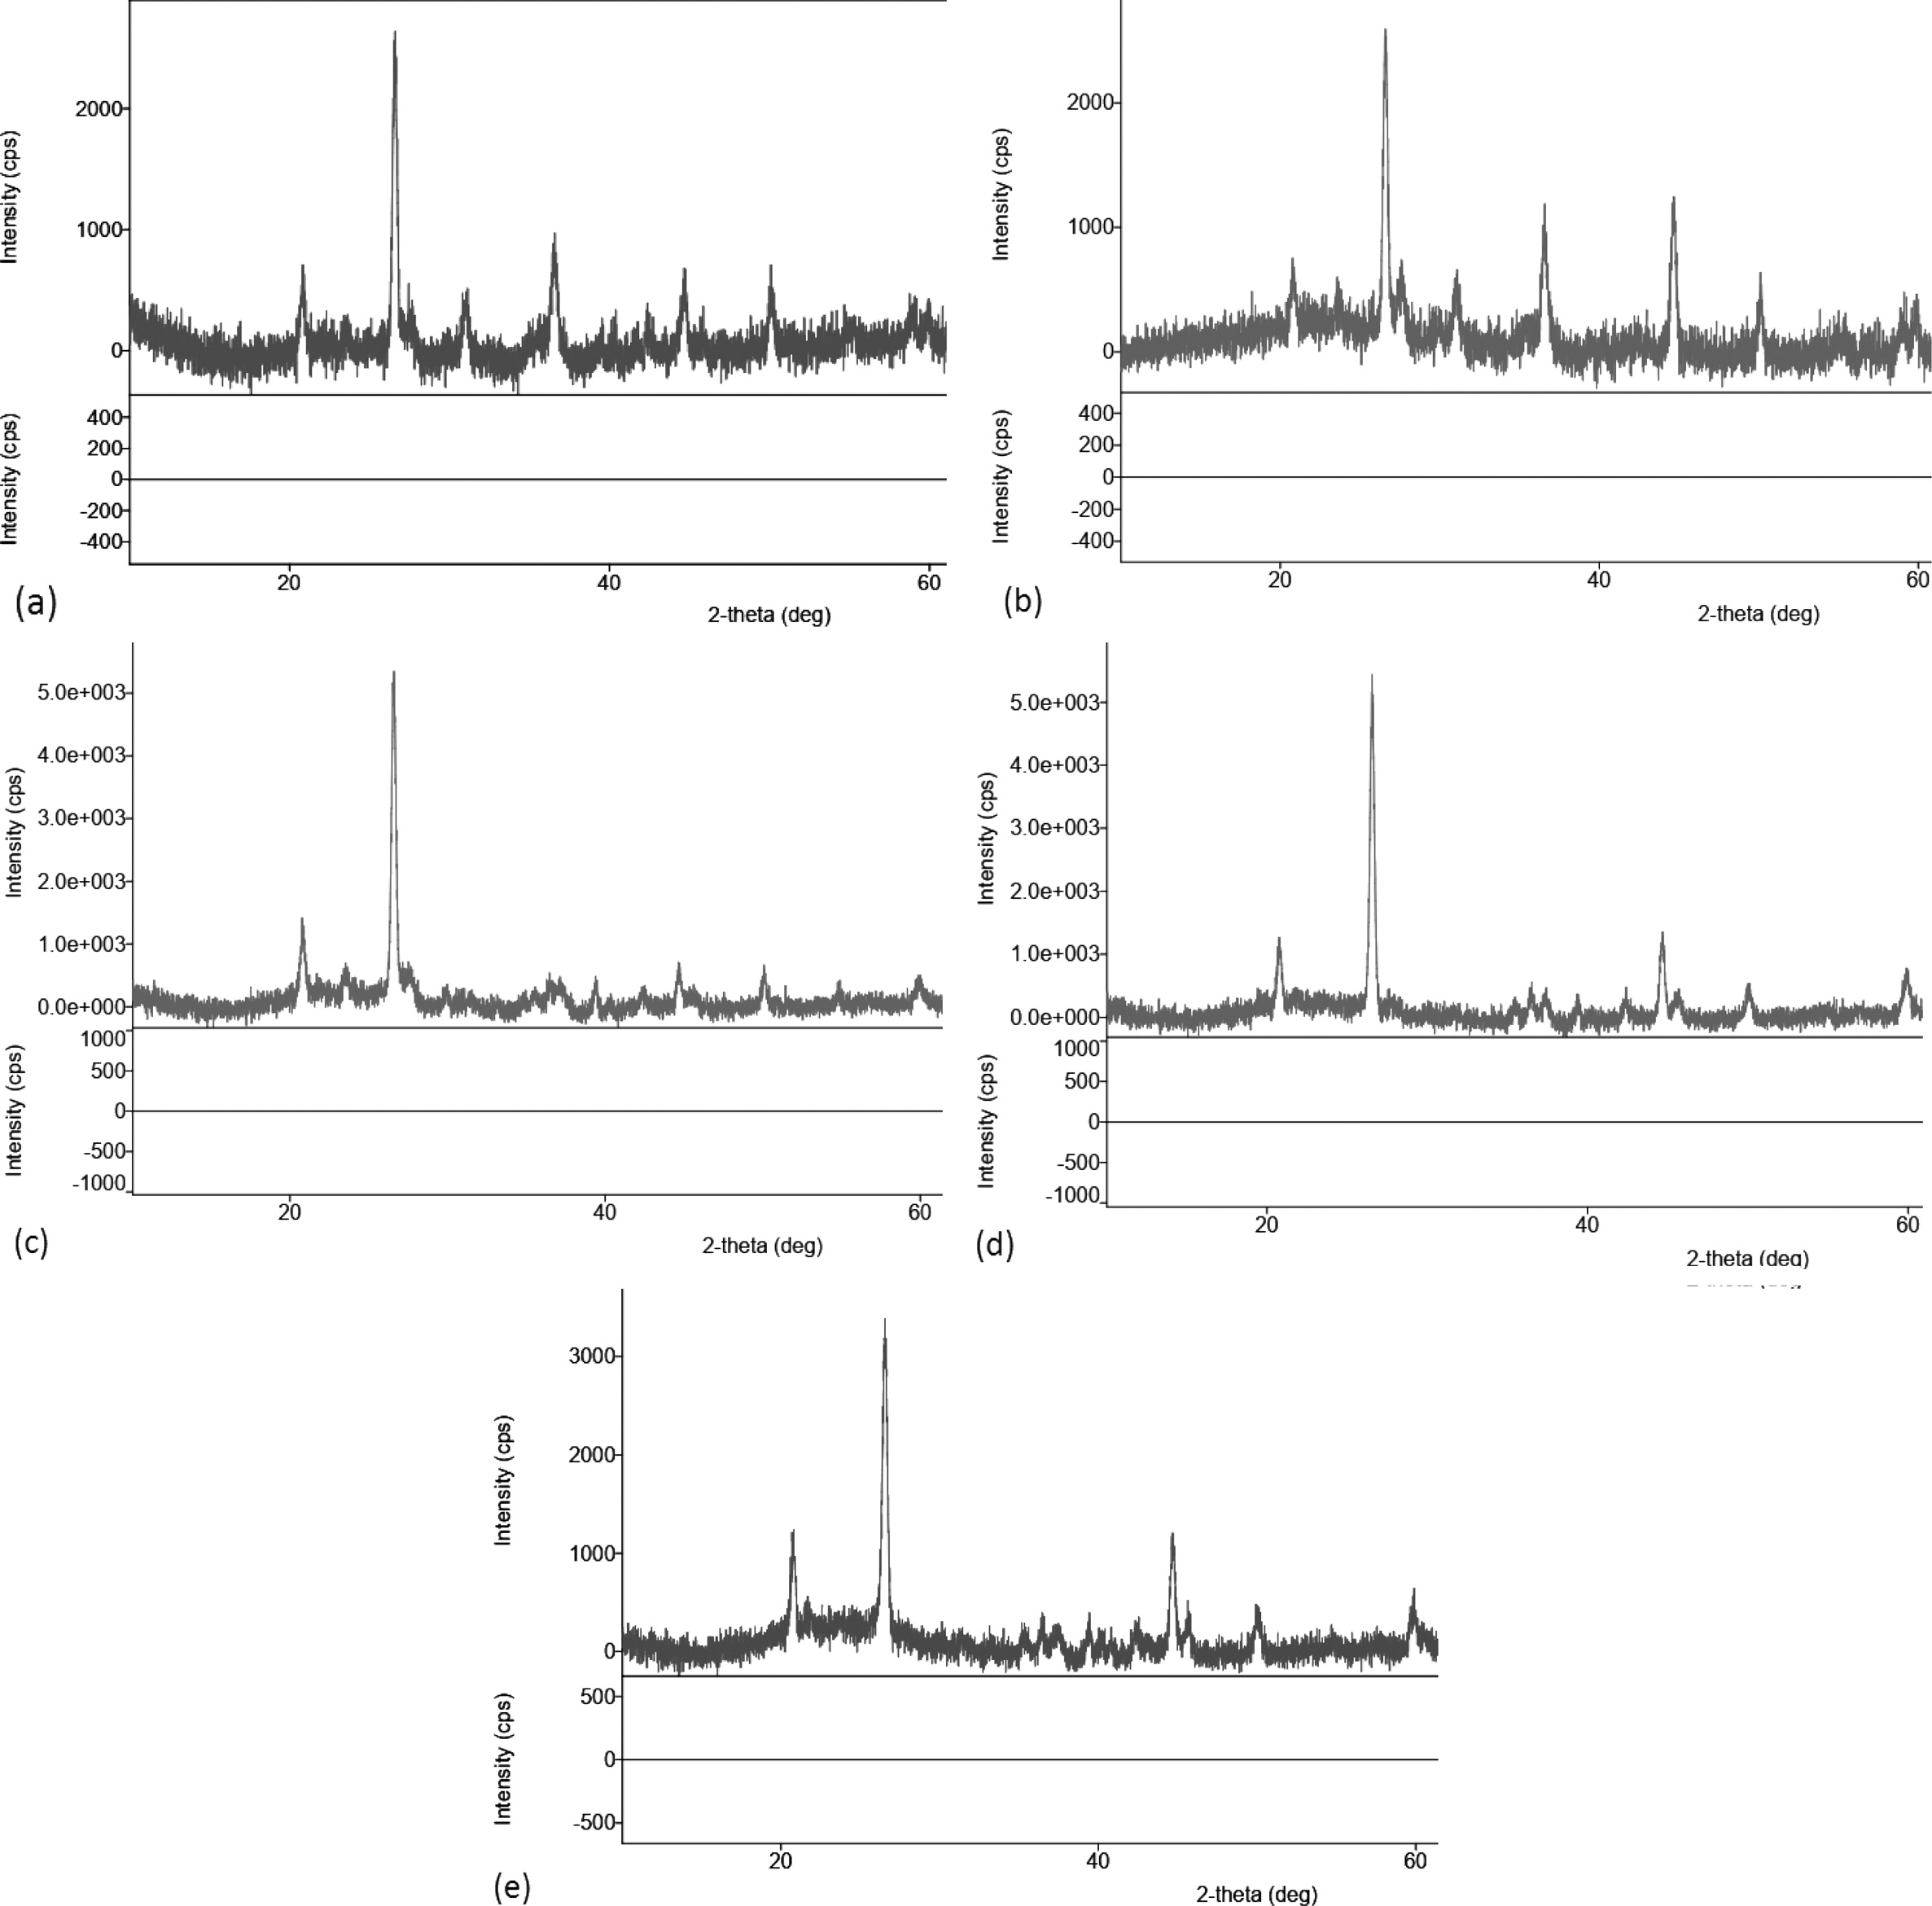
Diffractometric graphs of XRD test results for carbon ceramic composites with a composition ratio of 30:70, and sintering temperatures of 850 ℃, is shown in Fig. 17(a). Broadly speaking, fractography shows the state of amorphous carbon ceramic composites, cannot show the actual crystal state of the mixture of organoclay and carbon or amorphous. Some d spacing is located at 20° to 40° in Fig. 17, indicating the presence of organoclay; the rest is carbon and oxygen, according to the results of EDX testing. This happened to all carbon ceramic composites with sintering temperatures 850, 900, 950, 1000 and 1050℃. As a comparison of research studies with kaolin material which is a clay group also shows the same angle [6, 22, 23, 27, 31-33].
|
Fig. 17 Diffractogram of carbon ceramic composite, 30:70. |
Carbon ceramic composites from local materials from carbonized coconut coir waste with organoclay matrix have been successfully fabricated, with a hydraulic pressure of 200 bars. The higher the content of carbon powder, the higher the electrical conductivity produced. Likewise, the higher the sintering temperature of composite increases the electrical conductivity of carbon ceramic composite. The higher the carbon powder content reduces the composite wear rate. Carbon content can increase the hardness of carbon ceramic composites. Composite density tends to be relatively stable with increasing sintering temperature. Increasing the content of carbon powder has shown to reduce composite density. The composite is getting lighter. This proves that consistently clay or organoclay has a higher density than carbon. The higher the carbon content in the composite increases the percentage of porosity of carbon ceramic composites, but it can still increase the electrical conductivity. Generally, carbon ceramic composites contain macroporous.
The authors would like to thank the Directorate of Research and Community Service, Directorate General of Research and Development, Ministry of Research, Technology and Higher Education, the Republic of Indonesia for the funding of this research, in accordance with the research contract No. 022 / SP2H / LT / DRPM / 2018.
- 1. Štubňa I, Húlan T, Kaljuvee T, Vozár L. Appl Clay Sci. 153 (2018) 23-28.
-

- 2. Csáki Š, Ondruška J, Trnovcová V, Štubňa I, Dobroň P, Vozár L. Appl Clay Sci. 157 (2018) 19-23.
-

- 3. Ahn S, Nam K. J Ceram Process Res. 18[11] (2017) 767-776.
-

- 4. Manocha LM, Prasad G, Manocha S. Mech Adv Mater Struct. 21[3] (2014) 172-180.
-

- 5. He Y, Ping B, Lu L, Wang F, Hu S. Adv Appl Ceram Struct. 6753 (2017) 1-7.
-

- 6. Aramide FO, Popoola AP. J Ceram Process Res. 19[2] (2018) 87-94.
-

- 7. Tapasztó O, Lemmel H, Markó M, Balázsi K, Balázsi C, Tapasztó L. Chem Phys Lett. 614 (2014) 148-150.
-

- 8. Menchavez RL, Fuji M, Shirai T, Kumazawa T. J Eur Ceram Soc. 34[3] (2014) 717-729.
-

- 9. Maurício C, Vieira F, Sanchez R, Neves S, Lalla N, Quaranta N. J mater res technol. 2[2] (2013) 88-92.
-

- 10. Wang A, Gao X, Jr RFG, Chung DDL. Carbon N Y. 59 (2013) 76-92.
-

- 11. Matovi´c B, Stojmenovi´c M, Panti´c J, et al. J Asian Ceram Soc jo. 2 (2014) 117-122.
- 12. Yates M, Martín-luengo MA, Argomaniz LV, Velasco SN. Microporous Mesoporous Mater. 154 (2012) 87-92.
-

- 13. He Y, Lu L, Jin S, Hu S. Constr Build Mater. 53 (2014) 131-137.
-

- 14. Terzopoulou Z, Bikiaris DN, Triantafyllidis KS, et al. Thermochim Acta. 642 (2016) 67-80.
-

- 15. Gumula T, Rudawski A, Michalowski J, Blazewicz S. Ceram Int. 41[6] (2015) 7381-7386.
-

- 16. Amin MS, El-gamal SMA, Hashem FS. Constr Build Mater. 98 (2015) 237-249.
-

- 17. Zou W lie, Han Z, Vanapalli SK, Zhang J feng, Zhao G tao. Appl Clay Sci. 156 (2018) 116-125.
-

- 18. Trabelsi H, Romero E, Jamei M. Appl Clay Sci. 162 (2018) 57-68.
-

- 19. Pardo F, Jordan MM, Montero MA. Appl Clay Sci. 157 (2018) 158-164.
-

- 20. Mymrin V, Santos CFG, Alekseev K, et al. Appl Clay Sci. 155 (2018) 95-102.
-

- 21. Han B, Zhang L, Zhang C, Wang Y, Yu X, Ou J. Constr Build Mater. 125 (2016) 479-489.
-

- 22. Li Z, Zhang H, Zhao P, He X, Duan X, Science YJ. J Korean Ceram Soc. 55[1] (2018) 36-43.
-

- 23. Martín D, Aparicio P, Galán E. Appl Clay Sci. 161 (2018) 119-126.
-

- 24. Mocciaro A, Lombardi MB, Scian AN. Appl Clay Sci. 153 (2018) 90-94.
-

- 25. Pramono AE, Firdaus MBT, Ratriomasyo W, Nura MZ, Soedarsono JWM. J Ceram Process Res. 18[10] (2017) 748-753.
-

- 26. Pramono AE. J Mater Sci Eng B. 3[11] (2013) 700-706.
- 27. Ondruška J, Csáki Š, Trnovcová V, et al. Appl Clay Sci. 154 (2018) 36-42.
-

- 28. AL Rashid QA, Abuel-Naga HM, Leong EC, Lu Y, Al Abadi H. Appl Clay Sci. 156 (2018) 1-10.
-

- 29. Kubliha M, Trnovcová V, Ondruška J, Štubňa I, Bošák O, Kaljuvee T. Appl Clay Sci. 149 (2017) 8-12.
-

- 30. Loutou M, Hajjaji M. Appl Clay Sci. 150 (2017) 56-62.
-

- 31. B. A. Sakharov, V. A.Drits, D.K. Mccarty, Walker GM. Clays Clay Miner. 64[3] (2016) 314-333.
-

- 32. Hubadillah SK, Harun Z, Othman MHD, Ismail AF, Gani P. J Asian Ceram Soc. 4[2] (2016) 164-177.
-

- 33. Belmokhtar N, Ayadi H El, Ammari M, Allal L Ben. Appl Clay Sci. 162 (2018) 1-9.
-

 This Article
-
2019; 20(4): 333-346
Published on Aug 31, 2019
- Received on Jan 21, 2019
- Revised on May 28, 2019
- Accepted on Jul 10, 2019
 Services
- Abstract
introduction
experiments
results and discussion
conclusion
- Acknowledgements
- References
- Full Text PDF
Shared
 Correspondence to
- Agus Edy Pramono
-
Department of Mechanical Engineering, Politeknik Negeri Jakarta, Jl. Prof. Dr. G. A. Siwabessy, Kampus UI, Depok 16425, Jawa Barat, Indonesia
Tel : +62 811 829 833
Fax: +62 7863530 - E-mail: agus.edypramono@mesin.pnj.ac.id




 Copyright 2019 International Orgranization for Ceramic Processing. All rights reserved.