


- Photo- and radio- luminescence characterizations in rare-earth-doped SrAl2O4 crystals
Daisuke Nakauchia,*, Masanori Koshimizub, Noriaki Kawaguchia and Takayuki Yanagidaa
aDivision of Materials Science, Nara Institute of Science and Technology (NAIST), 8916-5 Takayama, Ikoma, Nara 630-0192, Japan
bDepartment of Applied Chemistry, Graduate School of Engineering, Tohoku University, 6-6-07 Aoba, Aramaki, Aoba, Sendai, Ibaraki 980-8579, Japan
SrAl2O4 bulk crystals doped with all rare-earth (RE) ions except for Sc, Y, La, Pm and Lu were synthesized by the optical floating zone method to systematically investigate the photoluminescence (PL) and radioluminescence (RL) properties for radiation detector applications. The crystal samples show PL and RL signals due to the 5d-4f or 4f-4f transitions of doped RE ions, and each decay curve consists of a sum of exponential functions with the typical decay time constants. Under VUV photon excitation, the Ce-, Pr-, Eu-, Tb-, Dy- and Ho-doped samples exhibit PL predominantly with two broad emission bands around 320 and 600 nm, which are possibly due to self-trapped excitons (STEs) perturbed by RE ions.
Keywords: Scintillator, Dosimetry, Radioluminescence, Photoluminescence, VUV, Crystal growth
Inorganic phosphors have attracted a great deal of interest as radiation detectors in response to increasing demands of radiation detection. Scintillators are phosphors which absorb ionizing radiation and immediately convert the energy to thousands of photons, so they have been used as active-type detectors in related fields of radiation detections including medical imaging [1], security [2], astrophysics [3], environmental monitoring [4] and resources exploration, e.g. oil-dwelling [5].
Rare-earth (RE) ions are effective activators as a luminescent center in scintillators, and most scintillators utilize the emission owing to spin- and parity- allowed 5d-4f transitions of RE featured with broad emission and fast decay time [6]. Such fast responses are very important especially in photon-counting detectors such as positron emission tomography (PET), which occupies a large market volume in scintillator applications. However, in addition to the fast 5d-4f luminescence, 4f-4f emission with microsecond decay time can be applied for some applications. In X-ray computed tomography, Pr,Ce,F:Gd2O2S (GOS) scintillators coupled with photodiodes are widely utilized [7], and the emission from Pr,Ce,F:GOS occurs by the 4f-4f transitions of Pr3+ with the decay time in microsecond order [8]. Since these integrated-type detectors read out scintillation photons as a current with a few milliseconds of integration, a fast decay time is not essential in integrated-type detectors unlike in PET [9].
For decades, RE-doped strontium aluminate compounds have been widely studied as phosphors [10, 11]. In particular, strontium dialuminate (SrAl2O4) co-doped with Eu and Dy has been reported as a long-lasting phosphorescent material exhibiting bright green emission and long afterglow [12, 13]. On the other hand, only a few works on luminescence characteristics under ionizing radiation have been reported [14, 15], and there was not even one report on radioluminescence (RL) properties in a bulk crystalline form until we reported [16-20]. In our previous study, we have found that a Eu-doped SrAl2O4 crystal exhibits a notably high scintillation light yield (46,000 ph/MeV [16]); therefore, SrAl2O4 can be a promising scintillator host material. In this study, as an extension of the researches, RE-doped SrAl2O4 crystals were prepared by the optical floating zone (FZ) method, the photoluminescence (PL) and RL characteristics were evaluated.
1 at.% RE-doped SrAl2O4 crystals (RE=Ce, Pr, Nd, Sm, Eu, Gd, Tb, Dy, Ho, Er, Tm and Yb) were synthesized by the optical FZ furnace (FZD0192, Canon Machinery Inc.) equipped with two halogen lamps as heat sources. The starting raw materials are as follows: RE2O3 (99.99 %, RE=Nd, Sm, Eu, Gd, Dy, Ho, Er, Tm and Yb), CeO2 (99.99 %), Pr6O11 (99.99 %), Tb4O7 (99.99 %), SrCO3 (99.99 %) and Al2O3 (99.99 %) powders. The homogeneously mixed powders were formed to cylinder rods by using hydrostatic pressure. The cylinder rods were sintered at 1500 ℃ for 6 hours to obtain solid polycrystalline rods. After that, crystal growth was performed using the FZ furnace. During the growth, the pull-down rate and rotation rate were 5 mm/h and 20 rpm, respectively.
The PL and PL excitation (PLE) spectra were measured using a spectrofluorometer (FP8600, JASCO). Then, PL quantum yield (QY) was evaluated using Quantaurus-QY (C11347-01, Hamamatsu Photonics). In addition, PL spectra under vacuum-ultraviolet (VUV) photon excitations (50-200 nm) were measured at a synchrotron facility (UVSOR, Japan). As a scintillation property, X-ray induced RL spectrum was measured utilizing our hand-made setup [21]. The irradiation source was an X-ray generator (XRB80P&N200X4550, Spellman) equipped with an ordinary X-ray tube with tungsten anode target and beryllium window. During the measurements, the X-ray generator was supplied with the bias voltage of 80 kV. While the sample was irradiated by X-rays, the RL photons from the sample were fed into the spectrometer (CCD: DU-420-BU2, Andor. Monochromator: SR163, Andor) through a 2 m optical fiber to measure the spectrum. In addition, RL decay time profiles were investigated using a pulse X-ray source with our original setup [22]. In decay time analyses, the decay time constant (t) was obtained by the least square fitting with a sum of exponential functions, where only the tail part of the decay curve was fitted because the fast decay part was not distinguishable from the instrumental response function.
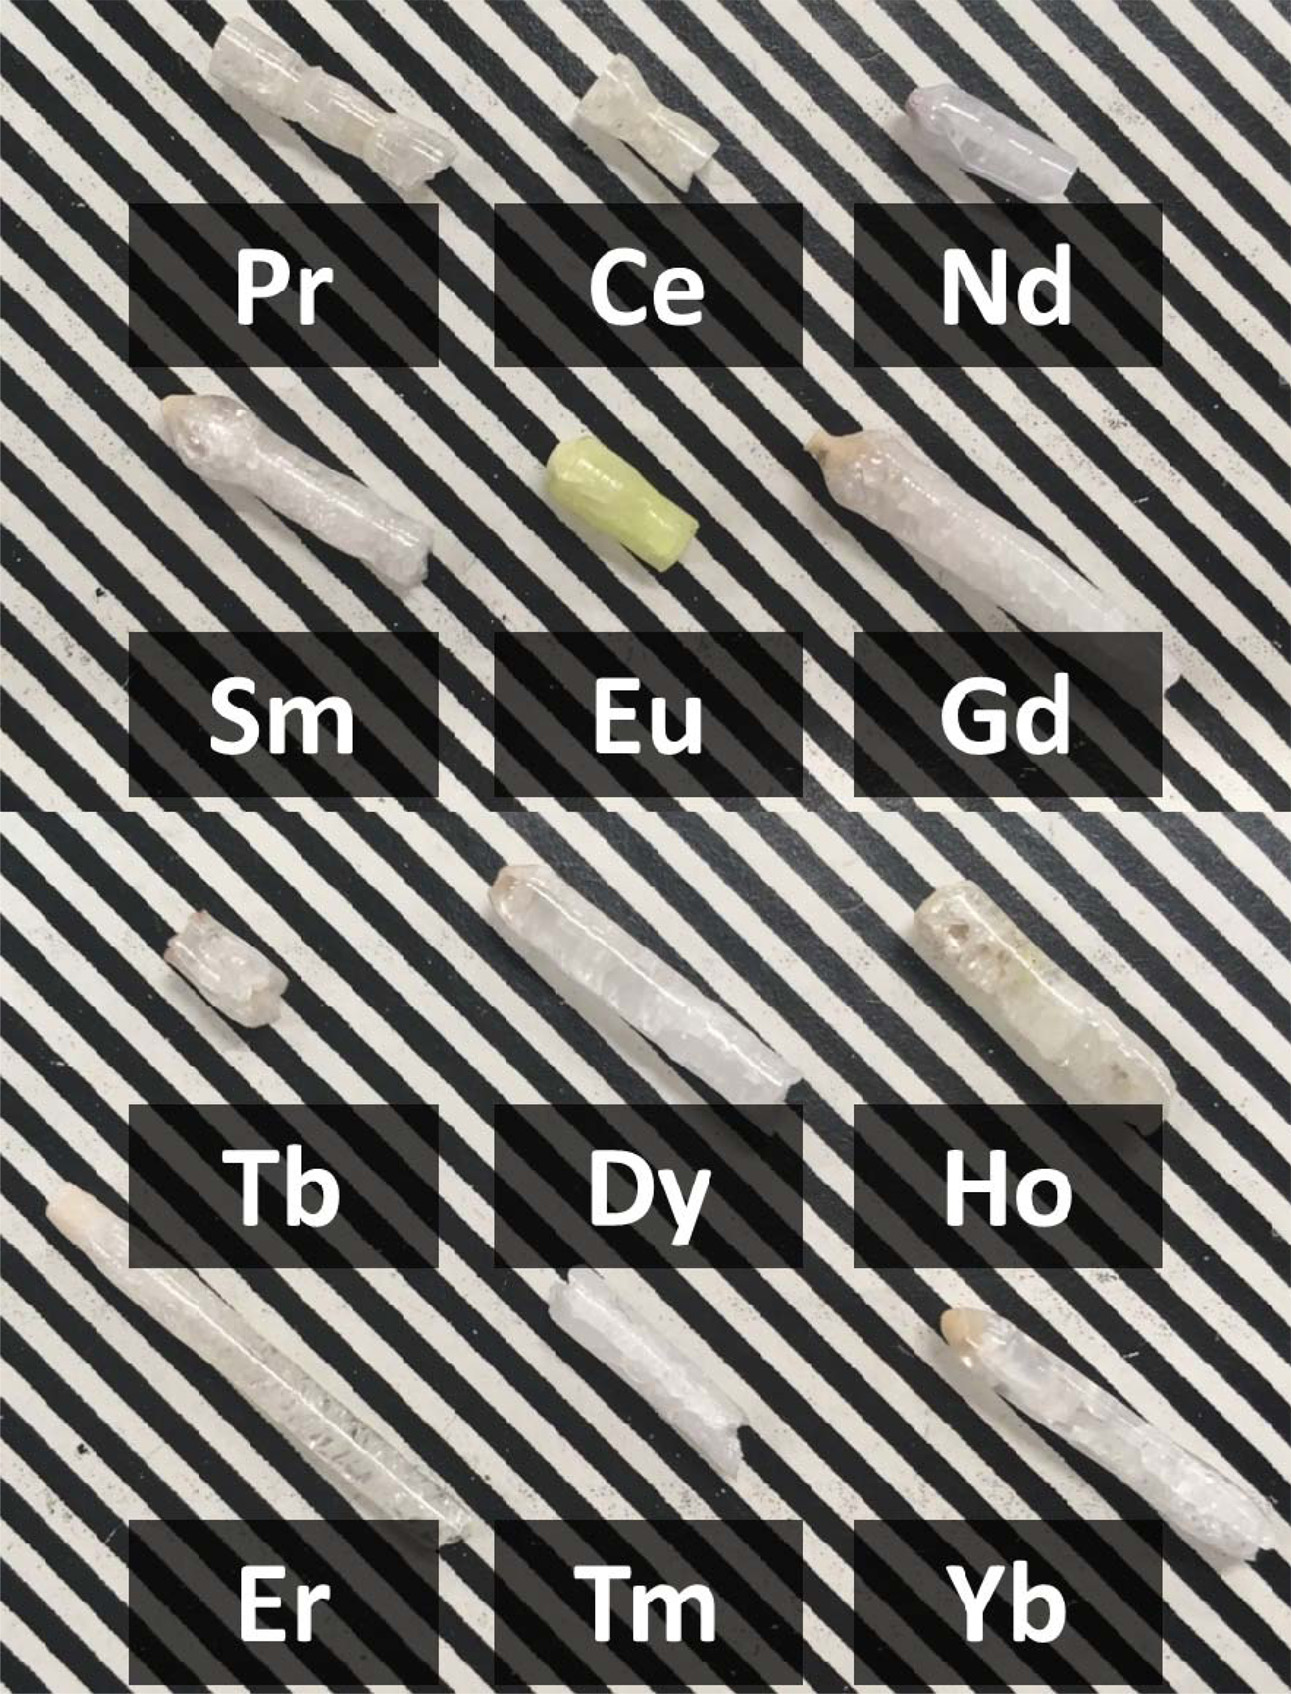
Fig. 1 shows the photograph of the synthesized crystal samples. All the crystal samples were successfully synthesized, and the sizes as-prepared crystals are 3-4 mm in diameter × 20-40 mm in length. The Eu-doped sample looks yellow and translucent owing to tiny cracks while the rest appear colorless and translucent.
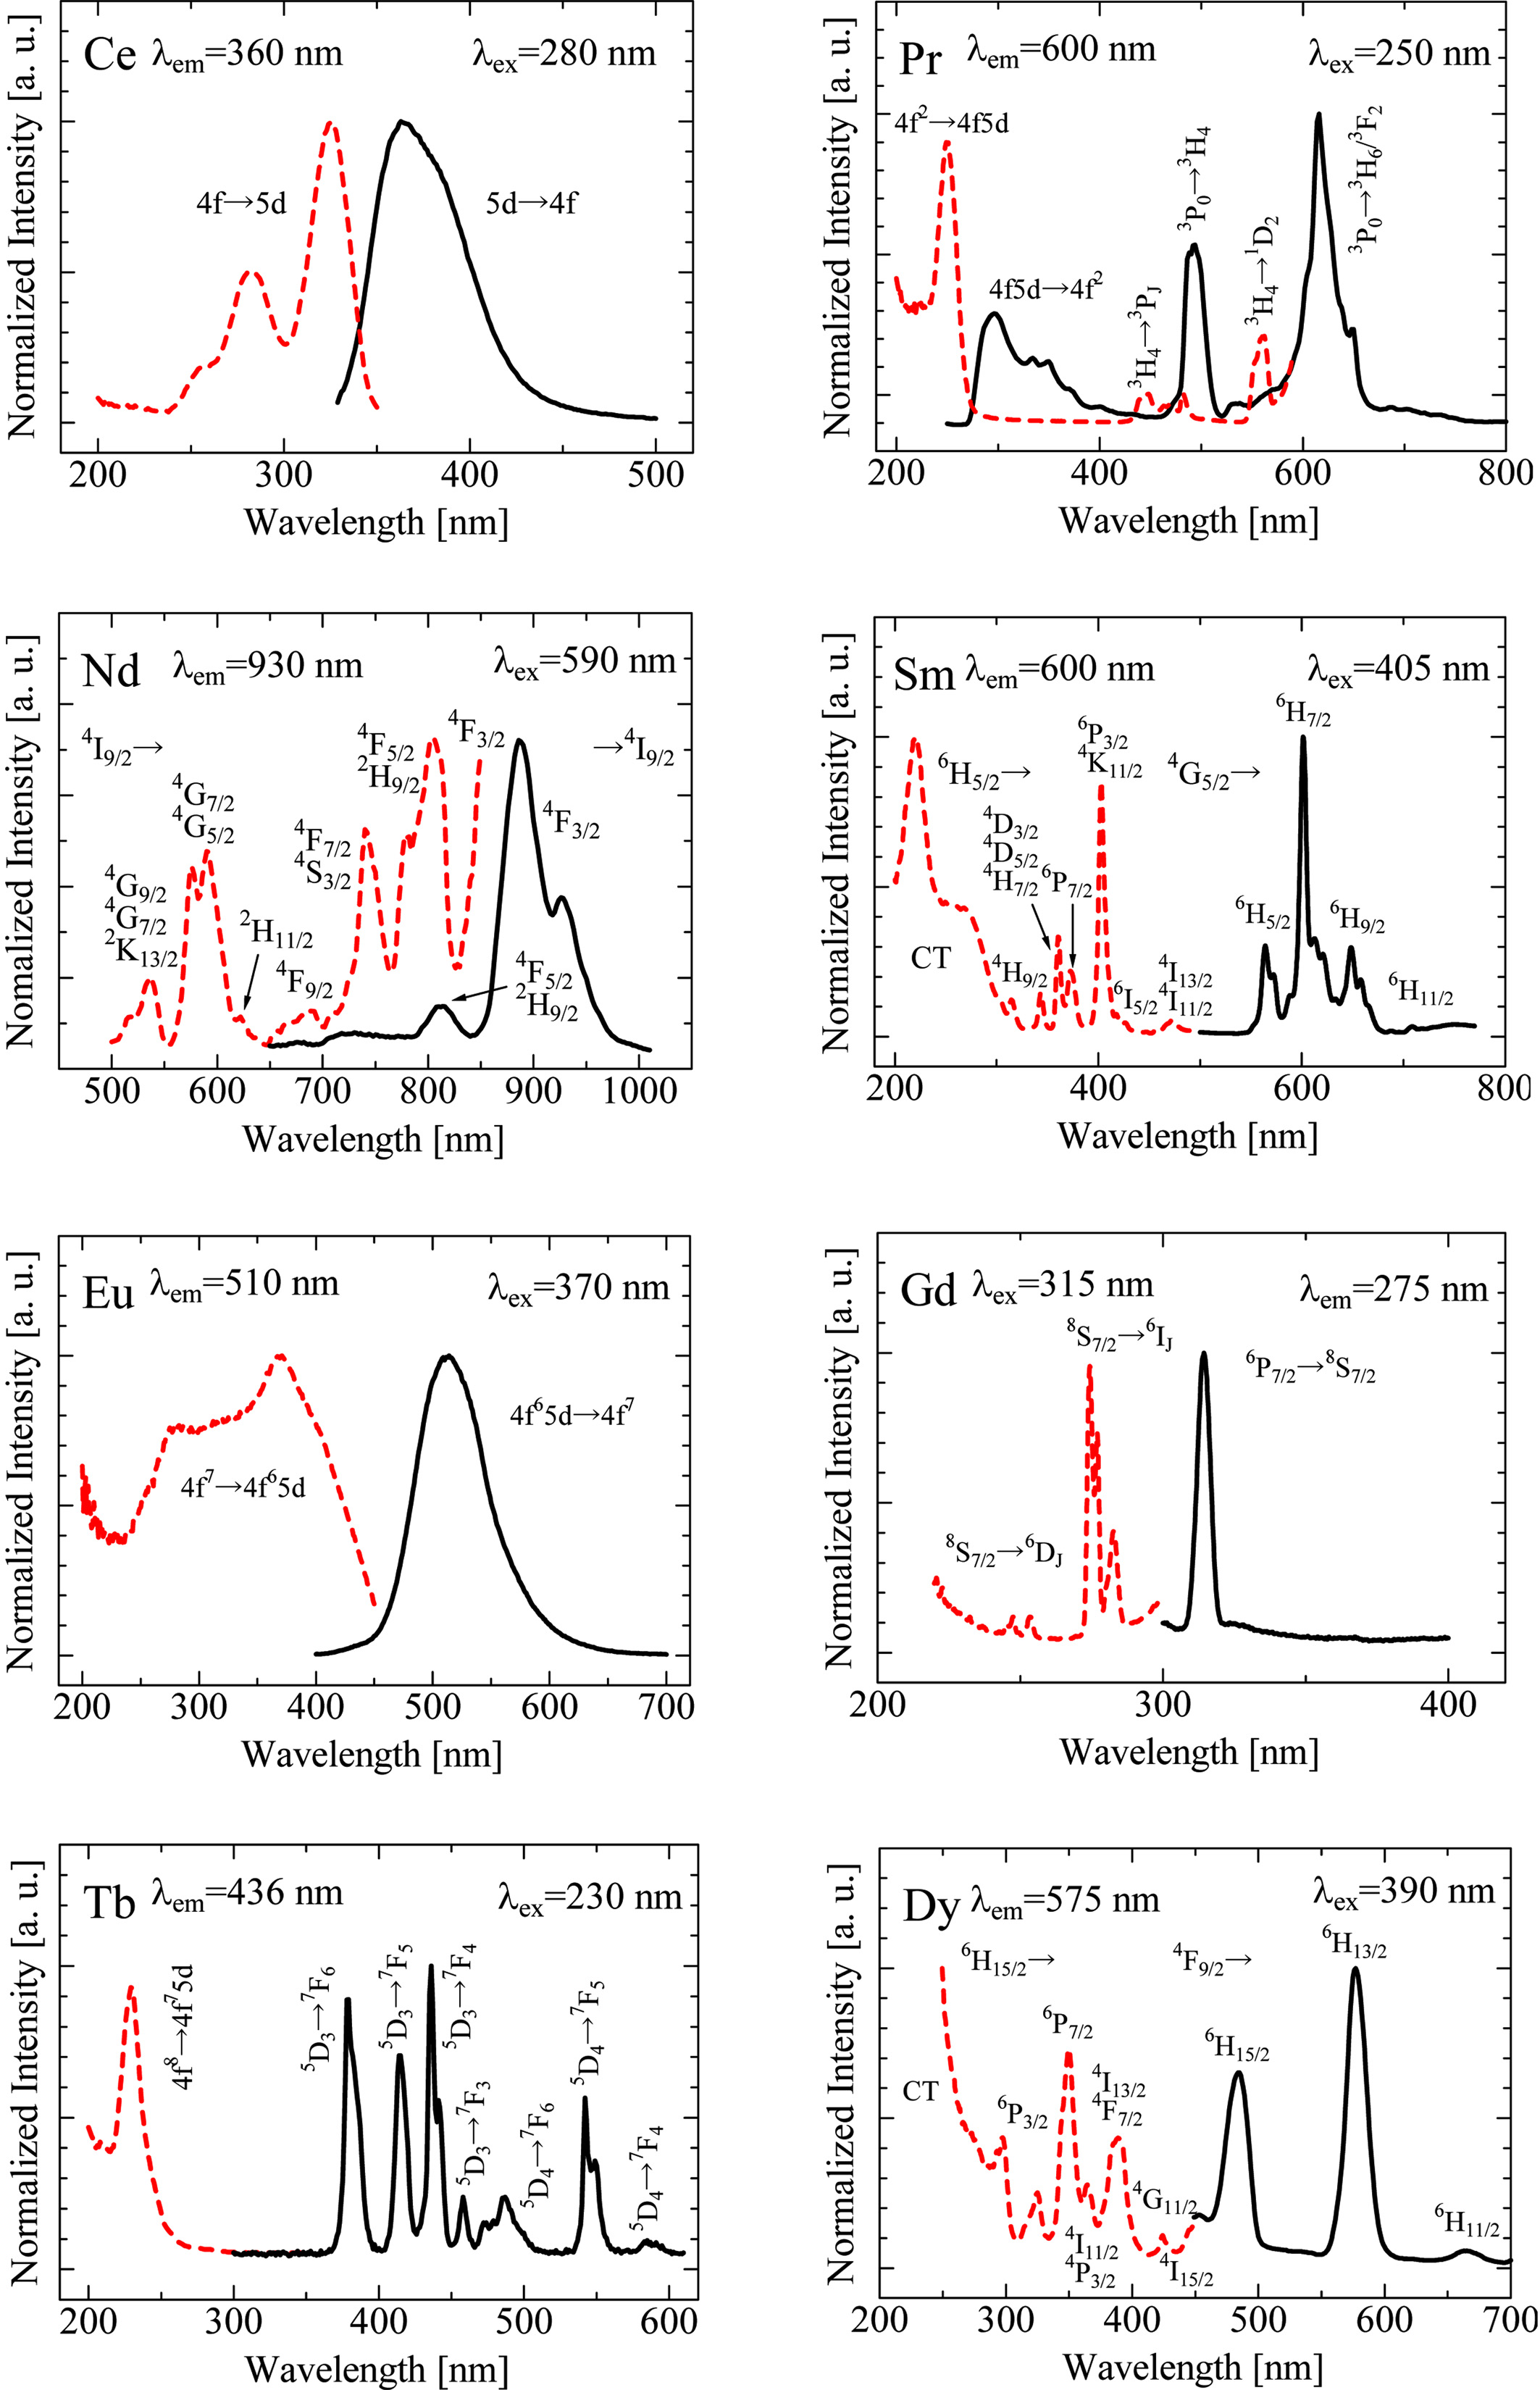
Fig. 2 illustrates the PL and PLE spectra of the crystal samples. The Ce- and Eu-doped samples show PL with a broad emission by spin- and parity-allowed 5d-4f transitions of Ce3+ and Eu2+ [10, 11], respectively. The Pr-doped sample also shows PL predominantly with several sharp emission peaks due to the 4f-4f transitions observed around 500-600 nm as well as a broad 5d-4f emission band around 300 nm [19]. The Nd-, Sm-, Gd-, Tb- and Dy-doped samples exhibit only several sharp emission peaks due to the 4f-4f transitions, which are almost the same as spectral shapes in different materials reported in different hosts [23-30]; however, the rest show no clear PL signals. The main emission peaks of Ho- and Er-doped samples are located in the near-infrared region and could not be observed using the equipment used in these analyses. Although Yb3+ is known to exhibit a broad emission owing to charge transfer (CT) luminescence, it is generally quenched at room temperature [31]. In the present Yb-doped sample, the CT luminescence was not observed owing to quenching as well. Tm3+ generally shows a strong emission around 440 nm, but it was difficult to observe the emission clearly in the present Tm-doped sample.
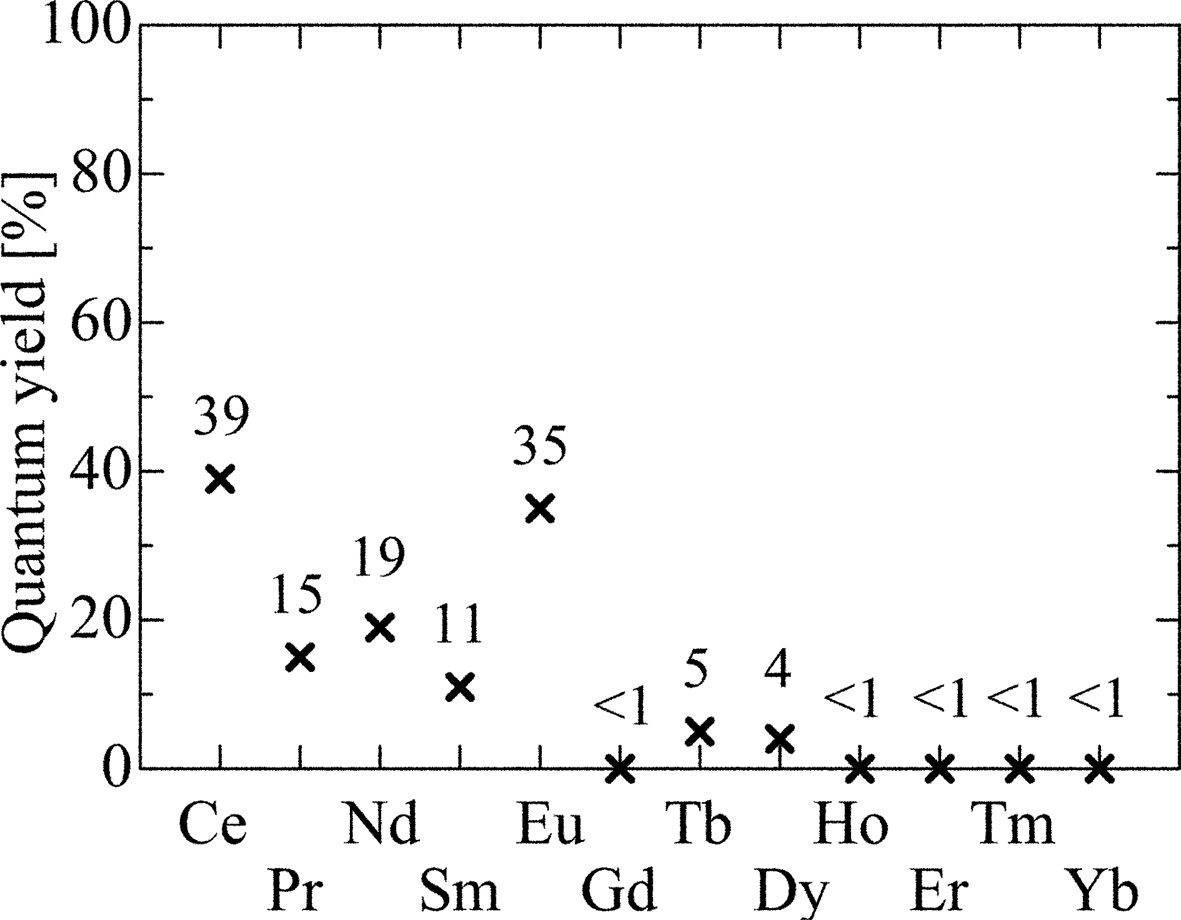
Fig. 3 summarizes the PL QY of the present samples. The Ce- and Eu-doped samples show relatively high QY values around 40%, and the Pr-, Nd- and Sm-doped crystals have medium values among the samples. As well as in PL spectrum measurements, the Ho-, Er-, Tm- and Yb-doped samples show no significant signal, and the calculated QY was less than 1%.
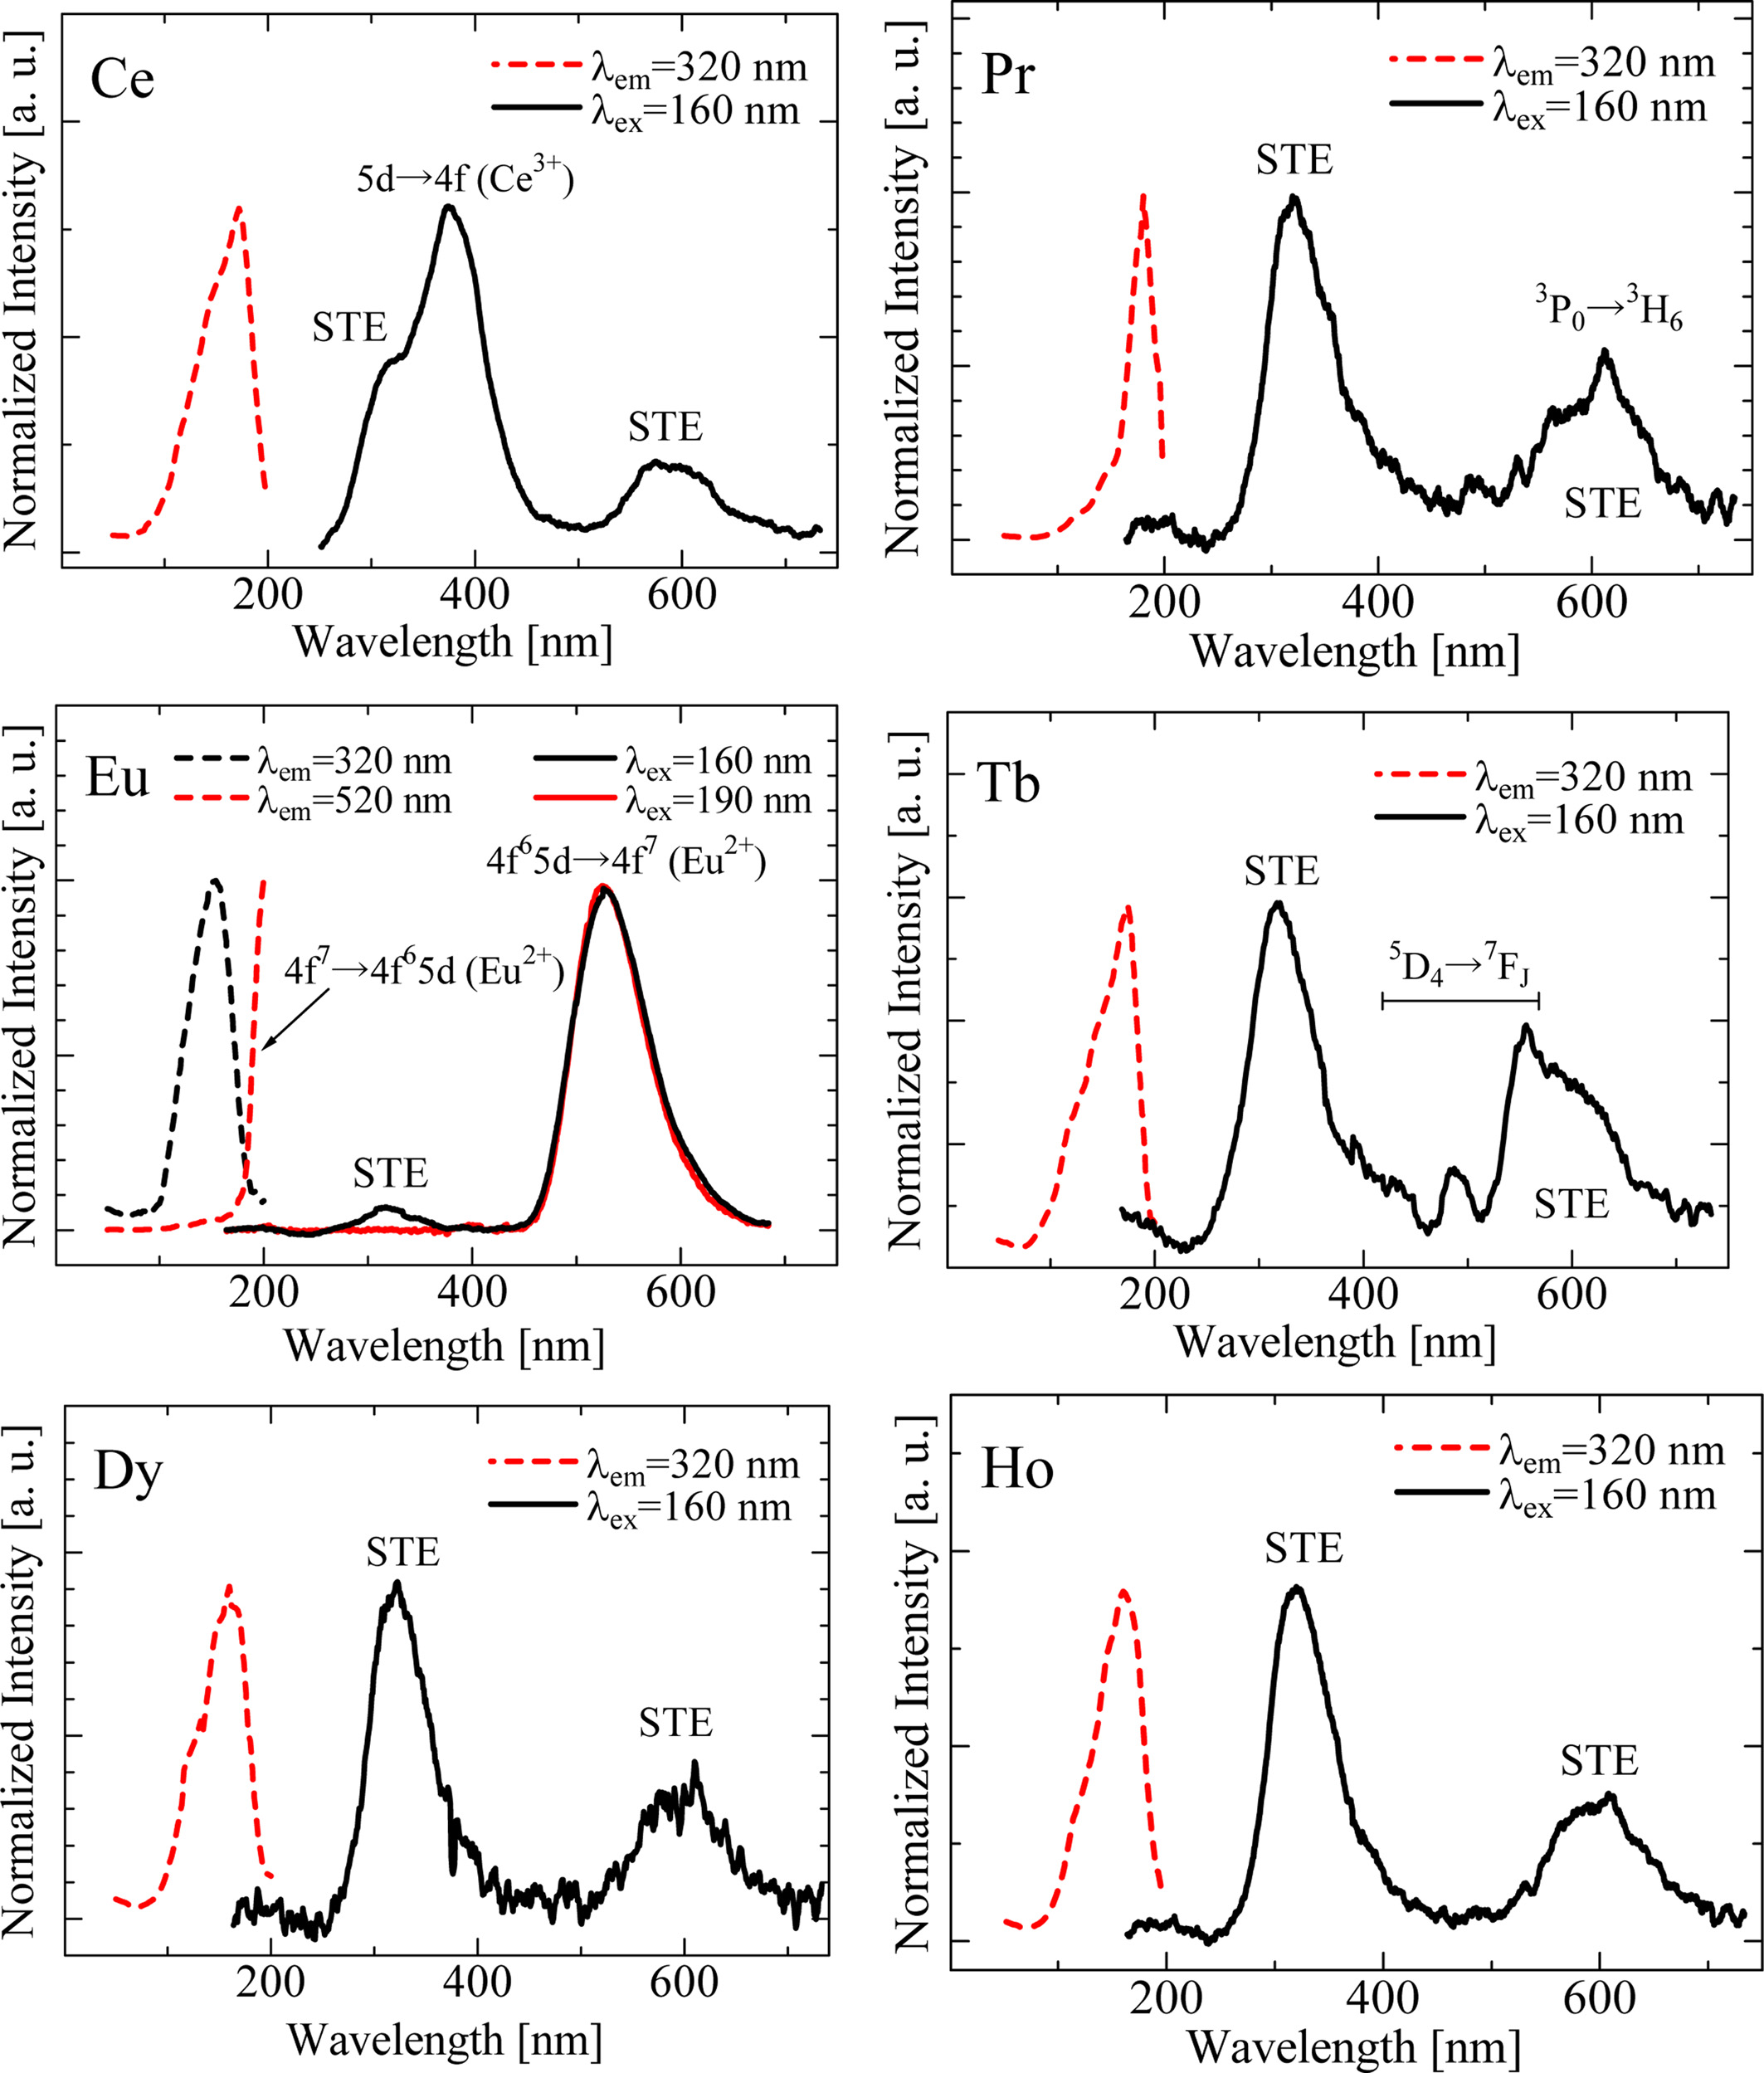
Fig. 4 illustrates the PL and PLE spectra in the excitation range from 50 to 200 nm. Owing to the machine time of the synchrotron facility, only the six samples shown in Fig. 4 were measured. All the samples show two broad bands around 340 and 600 nm. These emissions were also observed in the Nd-doped SrAl2O4 in the past study [17], and the undoped one did not exhibit such emission bands. The band-gap energy of the SrAl2O4 is reported to be 6.5 eV (~190 nm) [10], which is close to the observed excitation wavelength. In addition, these bands do not appear with photo-excitation within the band-gap energy. Hence, electronic transitions within the band-gap at defects or impurities are excluded as the origin. A plausible origin of these bands is self-trapped excitons (STEs) perturbed by RE ions [17]. As well as the STEs emission, the emission signals due to each dopant are observed in the Ce-, Pr-, Eu- and Tb-doped samples.
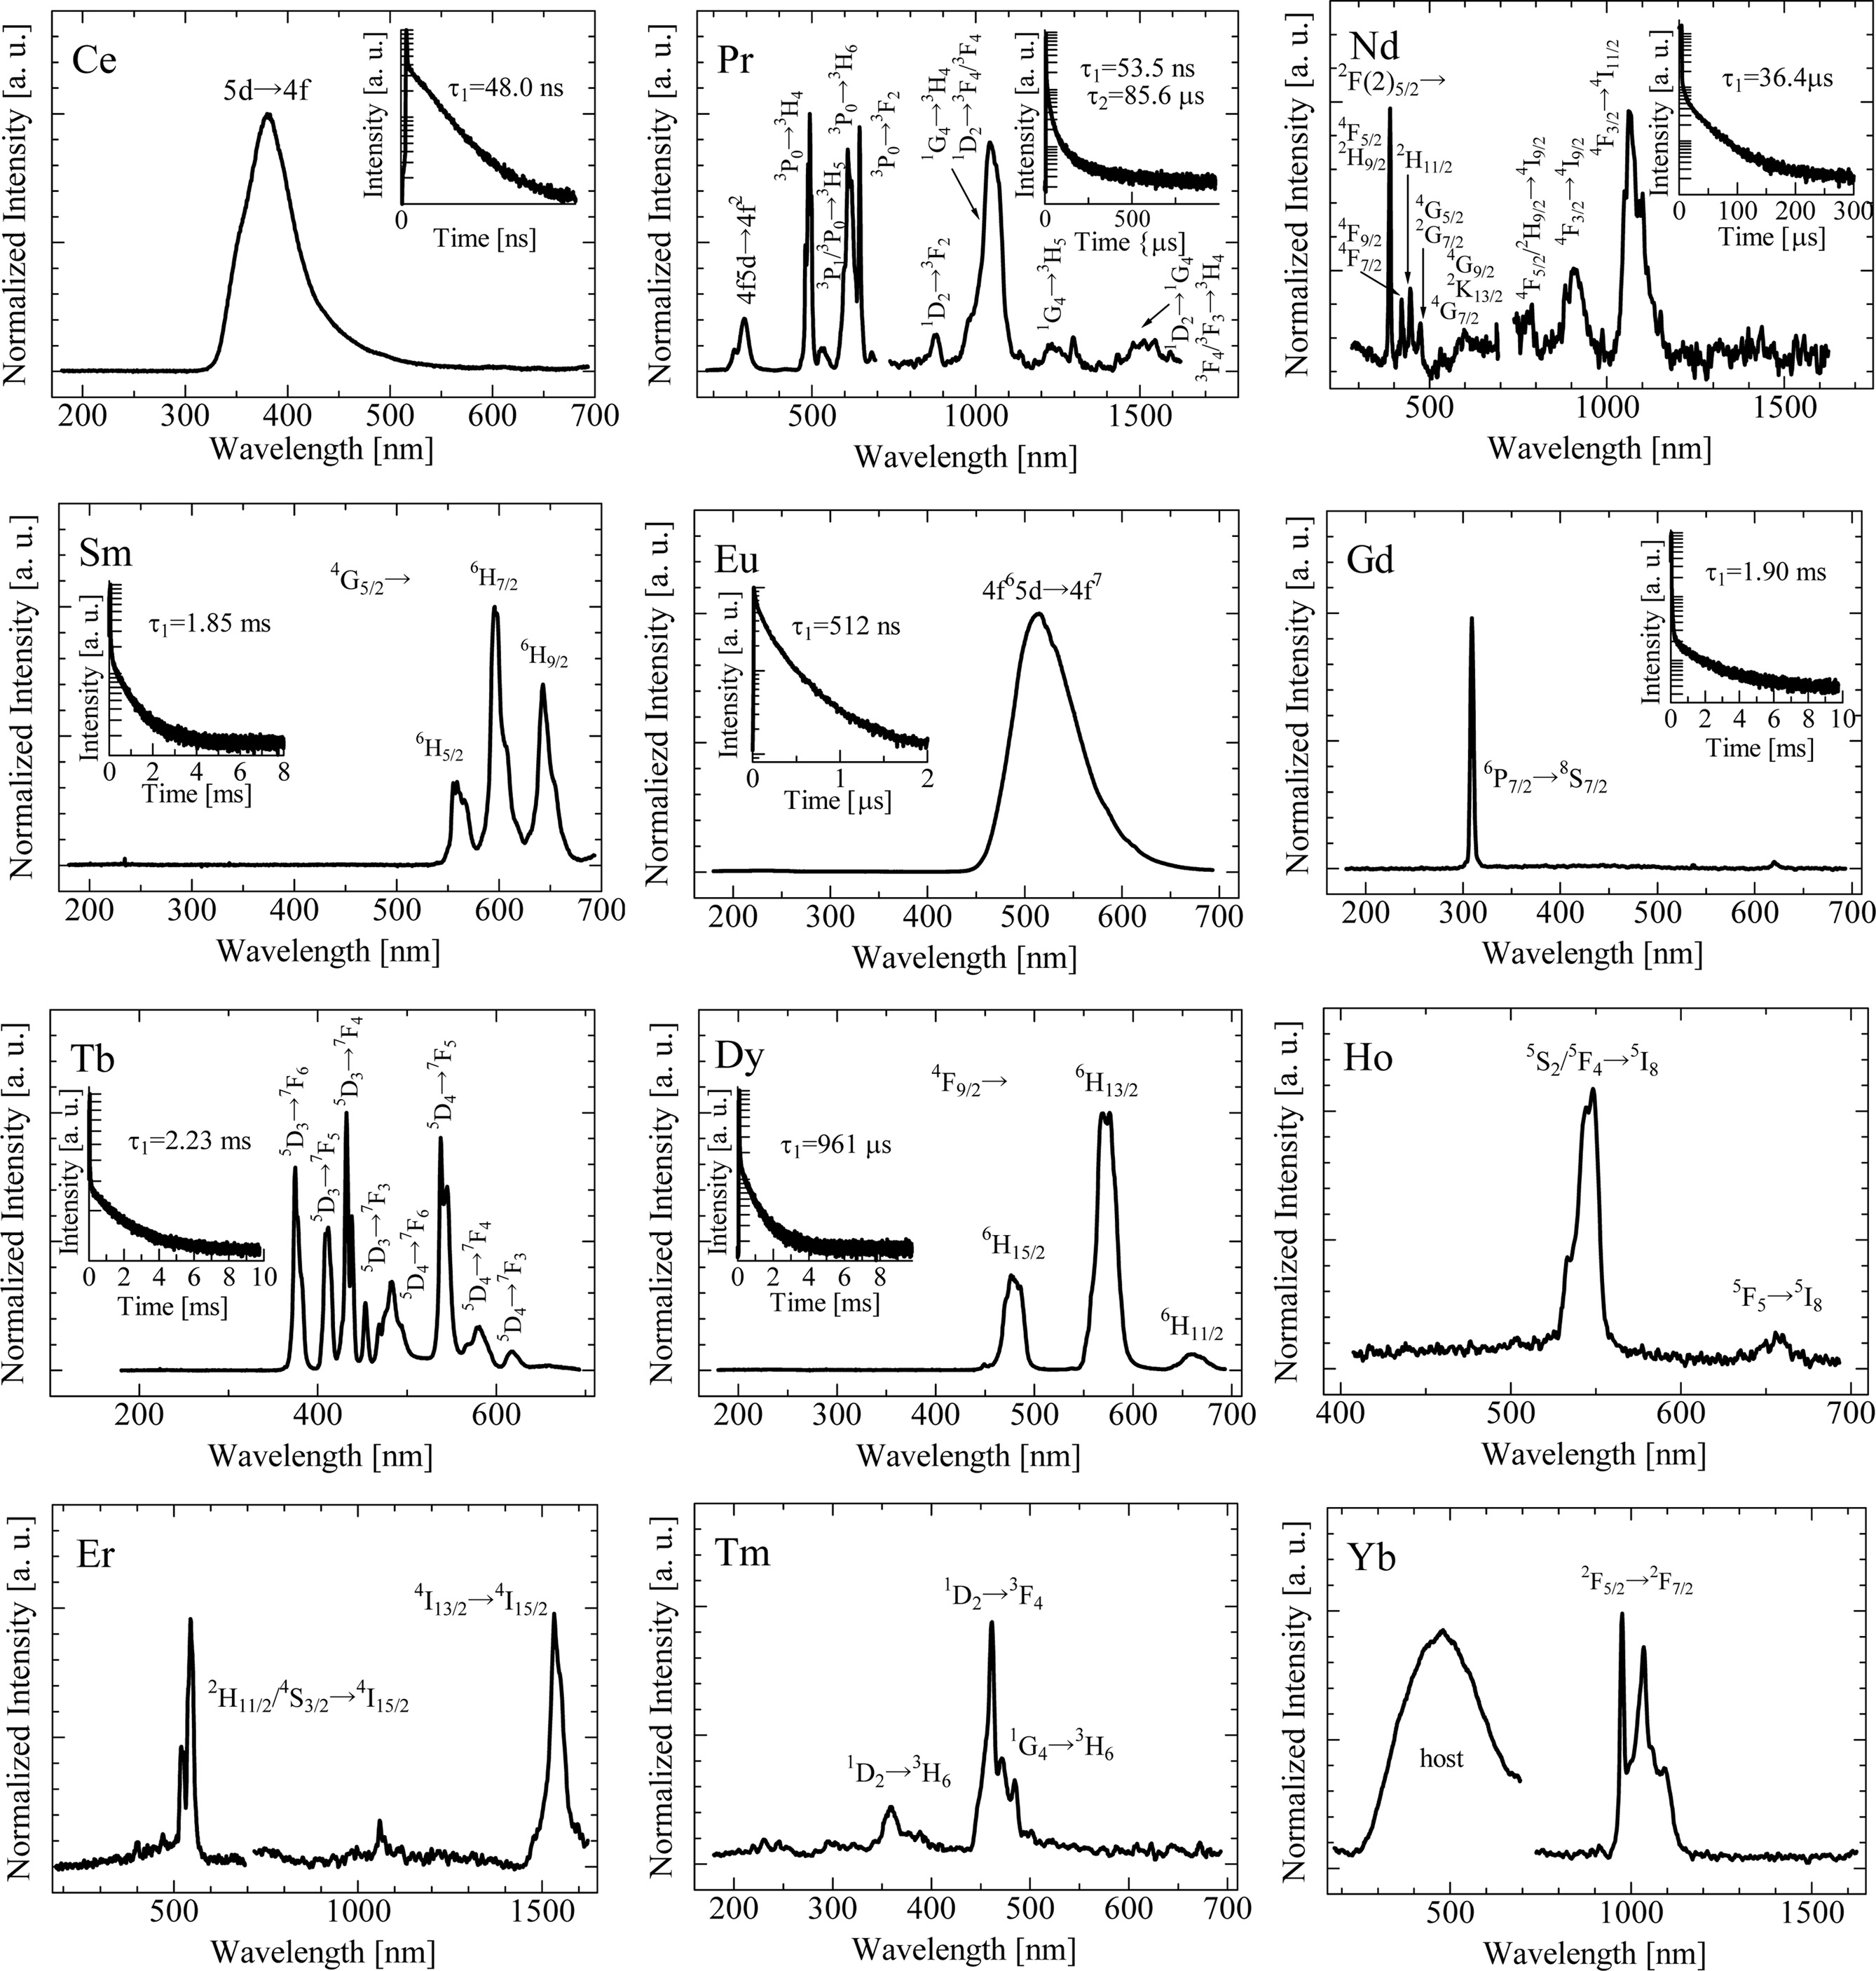
Fig. 5 illustrates the X-ray induced RL spectra. Under X-ray irradiation, all the samples exhibit the typical emission signals due to each dopant, which are similar to those in Fig. 2 or in some materials [10,32-35]. In the Yb-doped sample, a broad emission band appears around 490 nm as well as Yb3+ emission. Since the broad peak was observed in the undoped sample [20], and the origin is some kinds of host defects. However, because of the low RL intensities and the sensitivity wavelength of the used photomultiplier tube, the Ho, Tm, Er and Yb-doped samples exhibit no significant signals in the RL decay time as well as in PL spectrum analyses. In the Pr-doped sample, the decay curve consists of a sum of two exponential components. The decay time constants of the first and second components are close to the typical values of the 5d-4f and 4f-4f transitions of Pr3+, respectively [8, 36]. The decay curves of the rest are well-approximated by one exponential function. The Ce- and Eu-doped samples show the fast decay time constants in nanosecond order due to the 5d-4f transitions [18, 20] and can be utilized with photon-counting detectors requiring a fast response. The Nd-, Sm-, Gd-, Tb- and Dy-doped samples exhibit the decay curves with decay time constants in micro- and milli- second orders, which are almost the same values as those reported in different materials [35].
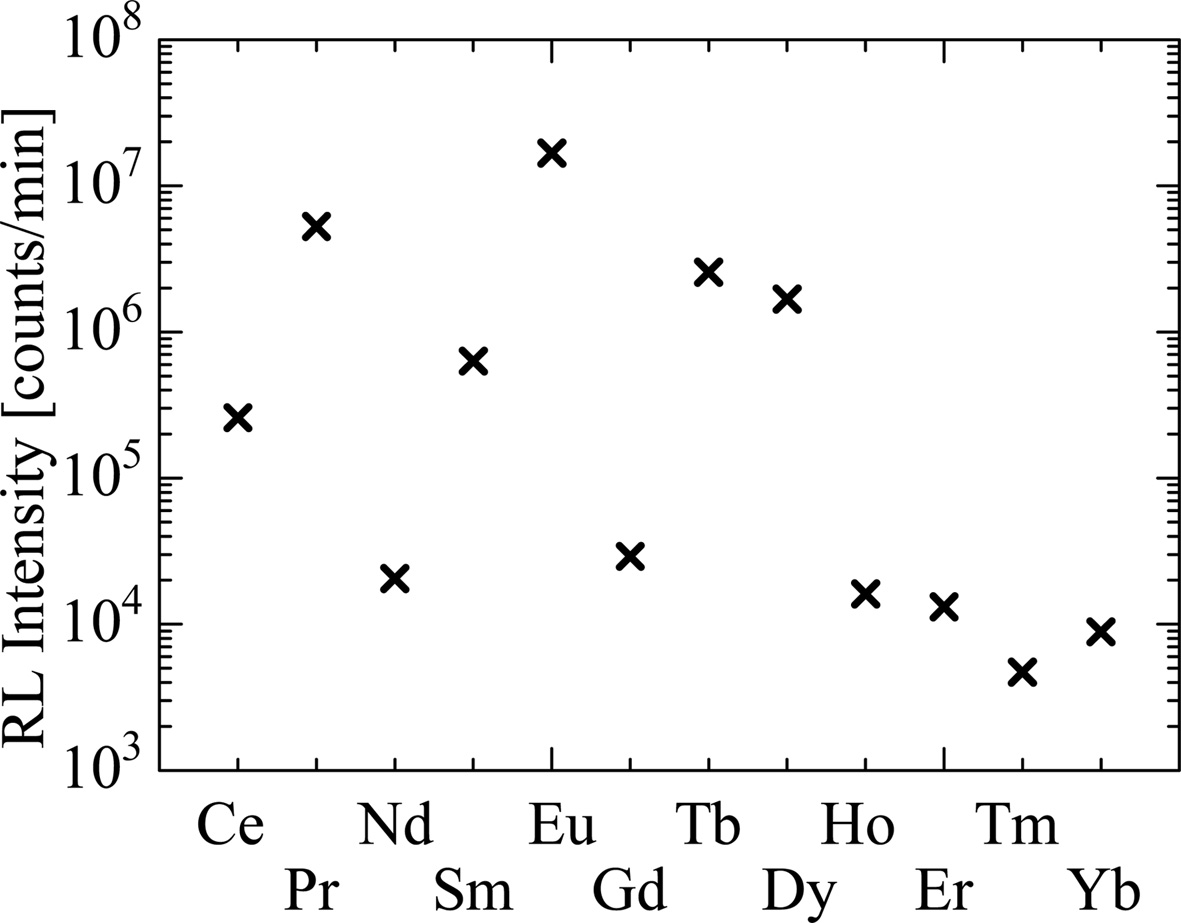
The integral values of RL intensity are summarized in Fig. 6. Since the instrument used for the UV-visible region is different from that for the near-infrared region, integral values only in the range from 180 to 700 nm were considered in these analyses. Although most of the samples show a similar tendency to that in PL QY, the Ce-doped sample shows low RL intensity in spite of the high QY. This is explained by two possibilities. First, the Stokes shift in the Ce-doped sample is the smallest among the present samples as shown in Fig. 2. The PL QY were determined using an instrument having reflective geometry while a transmission type geometry was used in RL characterizations [21]; therefore, in RL measurements, the influence of self-absorption may be larger than that in PL. In fact, the peak wavelength observed in RL (380 nm) is slightly longer than that in PL (360 nm). The second reason is the host defect. As shown in Fig. 2, the Eu-doped sample also shows a small Stokes shift. However, in Eu-doped SrAl2O4, since Eu2+ ions replace Sr2+ sites having divalent state with almost the same ionic radius, the strain of the host lattice is small. On the other hand, when introducing Ce3+ ions into Sr2+ sites, lattice defects generate owing to the charge imbalance of Ce3+ and Sr2+ in crystals and may result in increasing trap levels [37]. Such trap levels accumulate the energy of absorbed ionizing radiation, which decrease the scintillation lights. Yanagida reported that anti-correlation is observed between scintillation light yield and storage luminescence in some practical scintillators [6], supporting the second interpretation.
|
Fig. 1 A photograph of synthesized RE-doped SrAl2O4 crystals. |
|
Fig. 2 PL (solid line) and PLE (dashed line) spectra of synthesized RE-doped SrAl2O4 crystals |
|
Fig. 3 PL QY of synthesized RE-doped SrAl2O4 crystals. |
|
Fig. 4 PL (solid line) and PLE (dashed line) of synthesized RE-doped SrAl2O4 crystals under VUV photon excitation. |
|
Fig. 5 X-ray induced RL spectra of synthesized RE-doped SrAl2O4 crystals. The inset shows the decay curves of the samples. |
|
Fig. 6 Summary of integral values of RL signals in the range of 180-700 nm. |
RE-doped SrAl2O4 crystals were synthesized by the optical FZ method, and the PL and RL properties were reported. The Ce-, Pr- and Eu- doped samples show a broad emission band due to the 5d-4f transitions of RE ions, whose decay time constants are in nanosecond order; therefore, they are applicable to uses with photon-counting detectors. The rest shows several sharp peaks due to the 4f-4f transitions of REs having micro- or milli- seconds decay time constants. In comparison of PL QY and RL intensity of the Ce-doped sample, Ce3+-doping seems to have negative effects on the energy transport efficiency from the host to the emission center owing to the charge imbalance. The Pr-, Eu-, Tb- and Dy- doped samples exhibit relatively high RL intensities and are suitable for integrated-type detector among the samples.
This work was supported by Grant-in-Aid for Scientific Research A (17H01375), Scientific Research B (18H03468) and JSPS Research Fellow (17J09488) from JSPS as well as A-STEP from JST. The Cooperative Research Project of Research Institute of Electronics, Shizuoka University, Terumo Foundation for Life Sciences and Arts, Izumi Science and Technology Foundation, SEI Group CSR Foundation, The Iwatani Naoji Foundation and NAIST foundation are also acknowledged.
- 1. C.W.E. van Eijk, Nucl. Instrum. Methods Phys. Res. Sect. A 509 (2003) 17-25. doi:10.1016/S0168-9002(03)01542-0.
-

- 2. G. Harding, Radiat. Phys. Chem. 71 (2004) 869-881. doi: 10.1016/j.radphyschem.2004.04.111.
-
- 3. T. Itoh, T. Yanagida, M. Kokubun, M. Sato, R. Miyawaki, K. Makishima, T. Takashima, T. Tanaka, K. Nakazawa, T. Takahashi, N. Shimura, and H. Ishibashi, Nucl. Instrum. Methods Phys. Res. Sect. A 579 (2007) 239-242. doi: 10.1016/j.nima.2007.04.144.
-
- 4. L. Salonen, Sci. Total Environ. 130-131 (1993) 23-35. doi: 10.1016/0048-9697(93)90056-C.
-
- 5. C.L. Melcher, Nucl. Instrum. Methods Phys. Res. Sect. B 40-41 (1989) 1214-1218. doi:10.1016/0168-583X(89)90622-8.
-
- 6. T. Yanagida, Proc. Japan Acad. Ser. B 94 (2018) 75-97. doi:10.2183/pjab.94.007.
-
- 7. Y. Ito, H. Yamada, M. Yoshida, H. Fujii, G. Toda, H. Takeuchi, and Y. Tsukuda, Jpn. J. Appl. Phys. 27 (1988) L1371-L1373. doi:10.1143/JJAP.27.L1371.
-
- 8. C. Greskovich, and S. Duclos, Annu. Rev. Mater. Sci. 27 (1997) 69-88. doi:10.1146/annurev.matsci.27.1.69.
-
- 9. W. William, and W.W. Moses, Proceedings of the International Conference on Inorganic Scintillators and Their Applications: SCINT99, Moscow, Russia (1999) 11-21.
- 10. F.C. Palilla, A.K. Levine, and M.R. Tomkus, J. Electrochem. Soc. 115 (1968) 642-644. doi:10.1149/1.2411379.
-
- 11. Z. Fu, S. Zhou, and S. Zhang, J. Phys. Chem. B 109 (2005) 14396-14400. doi:10.1021/jp051313p.
-
- 12. T. Matsuzawa, J. Electrochem. Soc. 143 (1996) 2670-2673. doi:10.1149/1.1837067.
-
- 13. H. Yamamoto, and T. Matsuzawa, J. Lumin. 72-74 (1997) 287-289. doi:10.1016/S0022-2313(97)00012-4.
-
- 14. P.J.R. Montes, M.E.G. Valerio, and G. de M. Azevedo, Nucl. Instrum. Methods Phys. Res. Sect. B 266 (2008) 2923-2927. doi:10.1016/j.nimb.2008.03.140.
-
- 15. M. Ayvacikli, A. Ege, and N. Can, Opt. Mater. 34 (2011) 138-142. doi:10.1016/j.optmat.2011.07.023.
-
- 16. D. Nakauchi, G. Okada, K. Masanori, N. Kawano, N. Kawaguchi, and T. Yanagida, Nucl. Instrum. Methods Phys. Res. Sect. B 435 (2018) 273-277. doi:10.1016/j.nimb. 2018.01.007.
-
- 17. D. Nakauchi, G. Okada, M. Koshimizu, and T. Yanagida, J. Rare Earths 34 (2016) 757-762. doi:10.1016/S1002-0721 (16)60090-X.
-
- 18. D. Nakauchi, G. Okada, M. Koshimizu, and T. Yanagida, Nucl. Instrum. Methods Phys. Res. Sect. B 377 (2016) 89-93. doi:10.1016/j.nimb.2016.04.017.
-
- 19. D. Nakauchi, G. Okada, M. Koshimizu, and T. Yanagida, Radiat. Meas. 106 (2017) 170-174. doi:10.1016/j.radmeas. 2017.03.021.
-
- 20. D. Nakauchi, G. Okada, M. Koshimizu, and T. Yanagida, J. Lumin. 176 (2016) 342-346. doi:10.1016/j.jlumin.2016.04. 008.
-
- 21. T. Yanagida, K. Kamada, Y. Fujimoto, H. Yagi, and T. Yanagitani, Opt. Mater. 35 (2013) 2480-2485. doi:10.1016/j.optmat.2013.07.002.
-
- 22. T. Yanagida, Y. Fujimoto, T. Ito, K. Uchiyama, and K. Mori, Appl. Phys. Express 7 (2014) 062401. doi:10.7567/APEX.7.062401.
-
- 23. M. Djamal, L. Yuliantini, R. Hidayat, K. Boonin, P. Yasaka, and J. Kaewkhao, J. Technol. Soc. Sci. 1 (2017) 62-68.
- 24. T.Q. Leow, R. Hussin, Z. Ibrahim, K. Deraman, W.N.W. Shamsuri, and H.O. Lintang, Sains Malay. 44 (2015) 753-760.
-
- 25. A.N. Meza-Rocha, A. Speghini, R. Lozada-Morales, and U. Caldino, Opt. Mater. 58 (2016) 183-187. doi:10.1016/j.optmat.2016.05.043.
-
- 26. L. Ning, P.A. Tanner, V. V Harutunyan, E. Aleksanyan, V.N. Makhov, and M. Kirm, J. Lumin. 127 (2007) 397-403. doi:10.1016/j.jlumin.2007.01.019.
-
- 27. B.J. Chen, L.F. Shen, E.Y.B. Pun, and H. Lin, Opt. Express 20 (2012) 879-889.
-
- 28. J.A. Jiménez, Mater. Lett. 159 (2015) 193-196. doi:10.1016 /j.matlet.2015.06.110.
-
- 29. H. Kim, D. Zhou, Z. Yang, Z. Song, X. Yu, and J. Qiu, J. Non. Cryst. Solids 414 (2015) 21-26. doi:10.1016/j.jnoncrysol.2015.02.001.
-
- 30. T. Oya, D. Nakauchi, G. Okada, N. Kawaguchi, and T. Yanagida, Nucl. Instrum. Methods Phys. Res. Sect. A 866 (2017) 134-139. doi:10.1016/j.nima.2017.04.027.
-
- 31. L. Van Pieterson, M. Heeroma, E. De Heer, and a Meijerink, J. Lumin. 91 (2000) 177-193. doi:10.1016/S0022-2313(00)00214-3.
-
- 32. M. Quintanilla, O.N. Nuria, E. Cantelar, M. Ocana, and F. Cusso, Nanoscale 3 (2011) 1046-1052. doi:10.1039/c0nr00676a.
-
- 33. L. Guo, Y. Wang, J. Zhang, Y. Wang, and P. Dong, Nanoscale Res. Lett. 7 (2012) 636. doi:10.1186/1556-276X-7-636.
-
- 34. V. Naresh, and S. Buddhudu, Phys. Chem. Glas. Eur. J. Glas. Sci. Technol. B 56 (2015) 255-262. doi:10.13036/17533562.56.5.255.
-
- 35. N. Kumamoto, D. Nakauchi, T. Kato, G. Okada, N. Kawaguchi, and T. Yanagida, Sensors and Materials 29 (2017) 1417. doi:10.18494/SAM.2017.1621.
-
- 36. M.D. Birowosuto, P. Dorenbos, C.W.E. van Eijk, K.W. Krämer, and H.U. Güdel, IEEE Trans. Nucl. Sci. 53 (2006) 3028-3030.
-
- 37. H. Wu, Y. Hu, G. Ju, L. Chen, X. Wang, and Z. Yang, J. Lumin. 131 (2011) 2441-2445. doi:10.1016/j.jlumin.2011. 06.024.
-
 This Article
-
2019; 20(4): 307-313
Published on Aug 31, 2019
- Received on Nov 16, 2018
- Revised on Jan 16, 2019
- Accepted on May 9, 2019
Services
- Abstract
introduction
experimental
results and discussion
conclusions
- Acknowledgements
- References
- Full Text PDF
Shared
Correspondence to
- Daisuke Nakauchi
-
Division of Materials Science, Nara Institute of Science and Technology (NAIST), 8916-5 Takayama, Ikoma, Nara 630-0192, Japan
Tel : +81-743-72-6144 - E-mail: nakauchi.daisuke.mv7@ms.naist.jp
Clean-Energy Research Institute(CRI), Hanyang University, 222, Wangsimni-ro, Seongdong-gu, Seoul, 04763, Korea
E-mail: jcpr@hanyang.ac.kr