- Effect to optical properties by changing the Al2O3 ratio in K2O-Al2O3-P2O5 glasses
D. Shiratoria,*, Y. Isokawaa, H. Samizoa, M. Koshimizub, N. Kawaguchia and T. Yanagidaa
aDevision of Materials Science, Nara Institute of Science and Technology, 8916-5 Takayama-cho, Ikoma, Nara 630-0101, Japan
bDepartment of Applied Chemistry, Graduate School of Engineering, Tohoku University, 6-6-07 Aoba, Aramaki, Aoba-ku, Sendai, 980-8579, Japan
In this study, we prepared glasses with the composition of 0.1% Ce-doped (100-x) KPO3-xAl2O3 and investigated luminescent characteristics. The glass samples with different Al2O3 ratio (x = 5, 10, 15, 20, 25, 30 and 40) were synthesized by the melt quenching method. The All samples had high transmittance (80-90%) at wavelengths longer than 350 nm except for x = 40, and by increasing the Al2O3 ratio, the transmittance of the samples was improved. From the measurements of photoluminescence (PL) decay curve, the luminescence decay time was confirmed to be typical for the 5d-4f transition of Ce3+ (~30 ns). The samples showed thermally-stimulated luminescence (TSL), and the sensitivity of dose response was confirmed to be linear in the dose range from 0.01 mGy to 1 Gy for the x = 25 and 30 samples which showed the highest sensitivity among the present samples. The scintillation spectra show the broad luminescence around 300-500 nm, and these emission intensities were increased by increasing the Al2O3 ratio.
Keywords: Phosphate glass, Photoluminescence, Scintillation, Dosimeter, Al2O3
Luminescent materials have been used in radiation detectors for medical [1], security [2], environmental monitoring [3], personal dose monitor [4], oil-logging [5], and high energy physics [6, 7]. Luminescence intensity induced by ionizing radiations is proportional to the energy deposited in the material by the interaction with the ionizing radiation and material, and we can calculate the radiation dose or energy by the evaluation of the luminescence intensity. When the luminescent material is irradiated by ionizing radiation, firstly, an energetic electron is ejected from the lattice (in the case of crystalline materials), and this energetic electron generates a large number of secondary electrons via the Coulomb scattering. The generated secondary electrons show immediate light emission if they recombine with holes at localized luminescence centers or are captured by carrier trapping centers. The immediate emission is utilized for the scintillation detectors [8], and the captured carriers are used for the dose monitoring for a certain accumulation period of time [9]. When the external stimulation is given to trapped carriers, they are re-excited to the conduction band, and some of them can show emission by the recombination at luminescent centers. The number of trapped carriers is proportional to the dose irradiated within a certain accumulation period of time, and this trapping phenomenon can be used for the dosimeter. Typically, the certain accumulation period of time is one month for personal dosimeters. Because the initial steps until the generation of secondary electrons is the same, it is suggested that there is complementary relationship between scintillation and storage-type luminescence by ionizing radiations [10].
Ag-doped phosphate glass is one of the common materials for the dosimeter and shows luminescence called radio-photoluminescence (RPL) when irradiated with UV light after exposed ionizing radiation. Since the amount of luminescence of RPL of this glass is proportional to the ionizing radiation dose, it is applied to a commercial dosimeter by Chiyoda Technol Corp [11]. Although there are many kinds of material forms for dosimeters such as glass, ceramics and crystals, one of the biggest advantages of the glass materials is a wide range of freedom in chemical compositions. In addition to the benefit of the composition, glasses have a high workability and can be mass-produced easily.
Apart from the Ag-doped glass for the dosimeter, in general radiation detectors, Ce-doped materials have been widely used because Ce-doped materials show an intense absorption in the UV region and emission in the near UV or visible region. This luminescence wavelength is preferable since the wavelength sensitivity of conventional photomultiplier tubes used for radiation detection is high in UV-VIS wavelength. Trivalent Ce possesses parity allowed 4f-5d transition in the excitation, and non-radiative transition is less likely to occur by the large energy difference of ground and excitation states, and 5d-4f emission can be observed. However, rare-earth ions cause the concentration quenching phenomenon due to the clustering tendency, which decreases the luminescence yield of Ce3+ [12, 13].
Up to now, we have investigated Ce-doped glasses, and as a part of our continuous researches [14, 15], we report the Ce-doped KPO3-Al2O3 glass in this time. In our recent study, we found that the optimum concentration of Ce was around 0.1% [16], so we investigated the effect of changing the ratio of Al2O3 and KPO3 under the fixed Ce concentration of 0.1%. The addition of Al2O3 into the phosphate glass enhances the glass forming capacity and at the same time reduces the non-bridging oxygen [17]. Al2O3 increases the solubility of rare earth ions and restrain the concentration quenching phenomenon on luminescence [18]. Moreover, the presence of Al in a glass promote to reduce Ce4+ ions and increase Ce3+ ions [19]. However, the relation of the host composition (Al2O3 and KPO3 ratio) and radiation induced luminescence properties has not been studied yet. Therefore in this study, we prepared the glass with the composition of 0.1% Ce-doped (100-x) KPO3-xAl2O3 and investigated luminescent characteristics.
The compositions of samples were set to 0.1Ce:(100-x) KPO3-xAl2O3. Sample IDs and the melting temperature of each sample are shown in table 1. After mixing the raw material powders of CeO2 (4N), (KPO3)n (2N) and Al2O3 (4N) according to the composition listed in Table 1, the glasses were prepared by the conventional melt-quenching method using electric furnace with the temperature kept at 1100-1400 ℃ for 30 min in air atmosphere. The melt was then press-quenched between preheated stainless-steel plates kept at about 300 ℃. Finally, the samples were cut and polished to the typical size of ~6 × 6 mm2.
X-ray diffraction (XRD) patterns of the sample 40Al is measured by MiniFlex 600 (RIGAKU) in order to verify the precipitation in the glass sample. The in-line transmittance spectra were evaluated by using a spectrophotometer (V670, JASCO) across a spectral range 190-2700 nm with 1 nm interval. The PL excitation/emission spectra and PL quantum yields (QY) were obtained by Quantaurus-QY (C11347, Hamamatsu Photonics). The excitation and emission spectral ranges were 250-400 and 200-900 nm, respectively. In this measurement, the excitation interval was 10 nm. The PL decay lifetimes were evaluated using a fluorescence lifetime measurement system: Quantaurus-Tau (C11367, Hamamatsu Photonics). The excitation and monitoring wavelengths were determined based on the results of PL excitation/emission measurements. In order to evaluate excitation spectrum in vacuum ultra violet (VUV) wavelength, we have evaluated the excitation/emission spectra of all the samples at Synchrotron facility, UVSOR (BL7B). In this evaluation, the excitation wavelength was from 50 to 200 nm with 2 nm step.
We measured the TSL properties of the glass samples as a dosimetric properties. TSL glow curves were measured using TL-2000 (Nanogray Inc.) after irradiating X-ray (1 Gy) [20]. Here, the measured temperature range was 50-450 ℃ and the heating rate was 1 ℃/s. Each sample was annealed at 50 ℃ for 5 minutes before measurements. In addition, we measured a series of TSL glow curves with various irradiation doses 0.01-1000 mGy to obtain a dose response function for each glass sample. Here, the response value was defined as an integrated signal over the certain temperature range of measurement. The irradiation dose was controlled by distance from the X-ray source (0-82 cm), irradiation time (6-60 sec) and tube current (0.052-5.2 mA), and the dose was calibrated by using ionizing chamber (TN30013, PTW).
X-ray induced scintillation spectra were evaluated using our original measurement system [21]. An X-ray generator (OURTEX Corporation) equipped with a conventional X-ray tube was used as the radiation source. The X-ray tube was operated with a tube voltage and current of 80 kV and 1.2 mA, respectively. The emission from the samples were detected by using a CCD-based spectrometer (DU-420-BU2, Andor).
|
Table 1 Table 1. Compositions, sample IDs and melting temperatures of the samples investigated in the present work. |
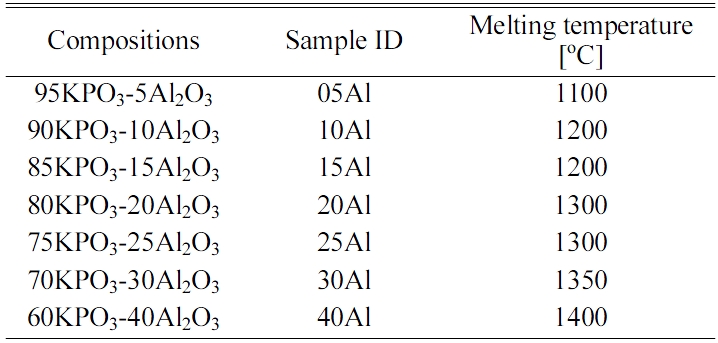
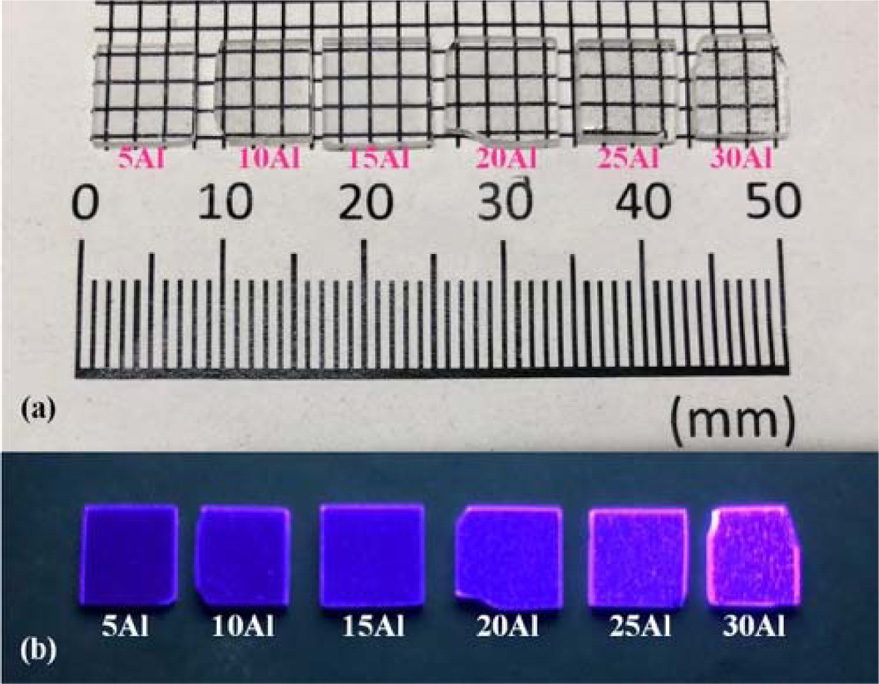
Fig. 1(a) shows the appearances of the glass samples prepared here. All the samples looked transparent to naked eyes under room right. When we irradiated UV photons from the UV lamp (302 nm), all the samples exhibited the bluish-purple luminescence, as shown in Fig. 1(b). Although most samples can be synthesized by the melt-quenching method, one of the samples, namely the ID-40Al, became a white opaque ceramic, although we tried to synthesis several times. In addition, we also tried to obtain 35Al sample, but we could not synthesis a fully transparent sample. Therefore, we concluded that the maximum Al2O3 ratio in this series of glasses would be around 30%.
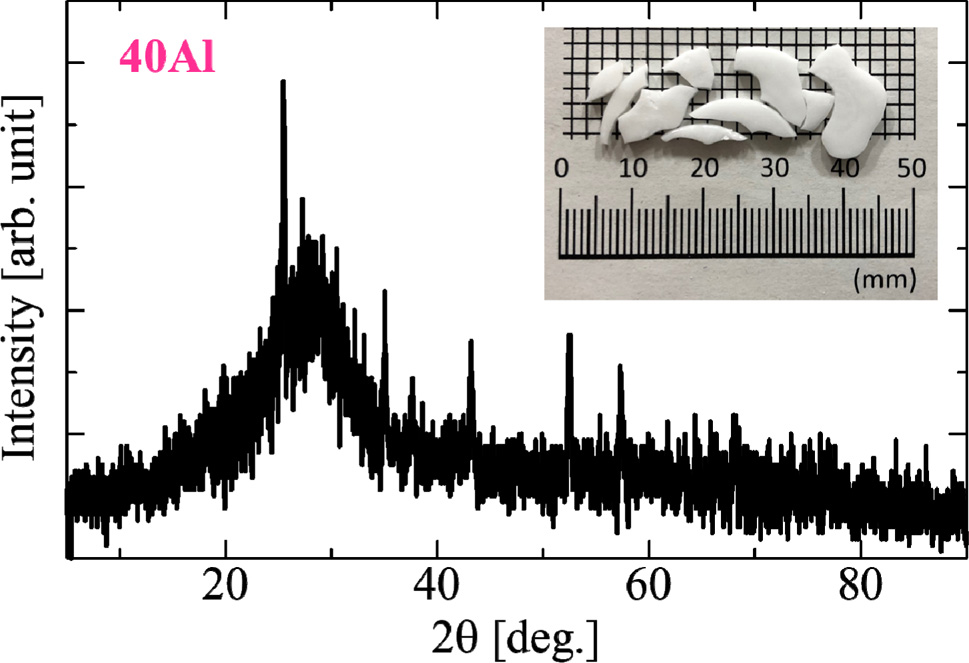
Fig. 2 shows the result of XRD measurement for 40Al sample. The measurement result showed several diffraction peaks in addition to the halo peak at the range of 10-40 degrees, suggesting that the sample is mainly a glass containing some amorphous states. Since this diffraction pattern is roughly in agreement with the pattern of Al2O3, we consider that Al2O3 microcrystals mixed in the glass make the sample whitened.
|
Fig. 1 Fig. 1. Photographs of the glass samples under (a) room light and (b) UV irradiation (302 nm). |
|
Fig. 2 Fig. 2. XRD pattern of the glass sample 40Al. |
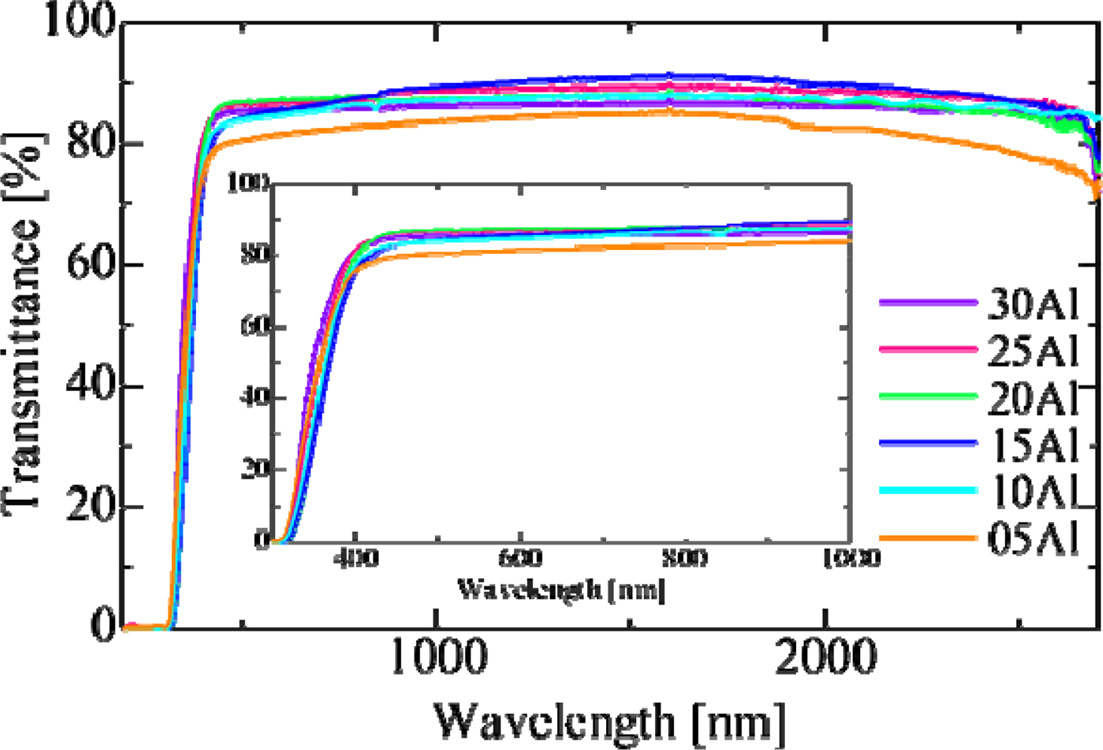
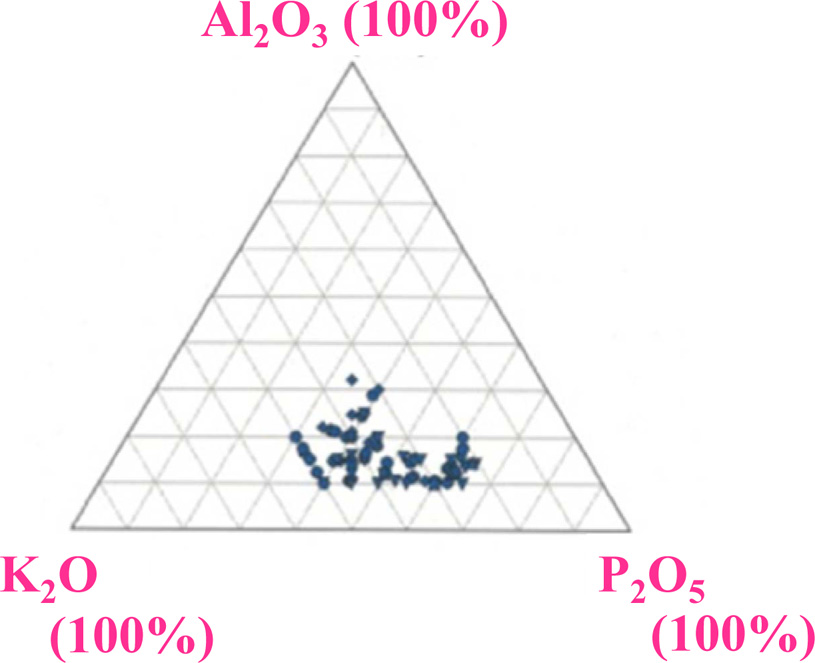
Fig. 3 shows in-line transmittance spectra of all the samples except for ID-40Al. These samples indicated a high transmittance at the wavelength longer than 350 nm, and the transmittance reached to 80-90% at visible wavelength. By increasing the Al2O3 ratio, the transmittance of the samples is improved. Generally, the transmittance decreases when impurities are added to glass, but in the present case,Al2O3 can form a glass network as a host element rather than as an impurity. In addition, it is known that Al2O3 reduces non-bridging oxygen and blends well with alkali metal. As a result, addition of Al2O3 in our glass worked to suppress scattering and absorption in the glass. As shown in Fig. 4, the glass forming region of K2O-Al2O3-P2O5 ternary system shows that content of Al2O3 is limited to about 30% [22], and this is consistent with our results. The absorption below 350 nm was ascribed to 4f-5d absorption of Ce3+ ions, and the absorption levels were similar in all the samples despite the difference of the chemical composition of the host.
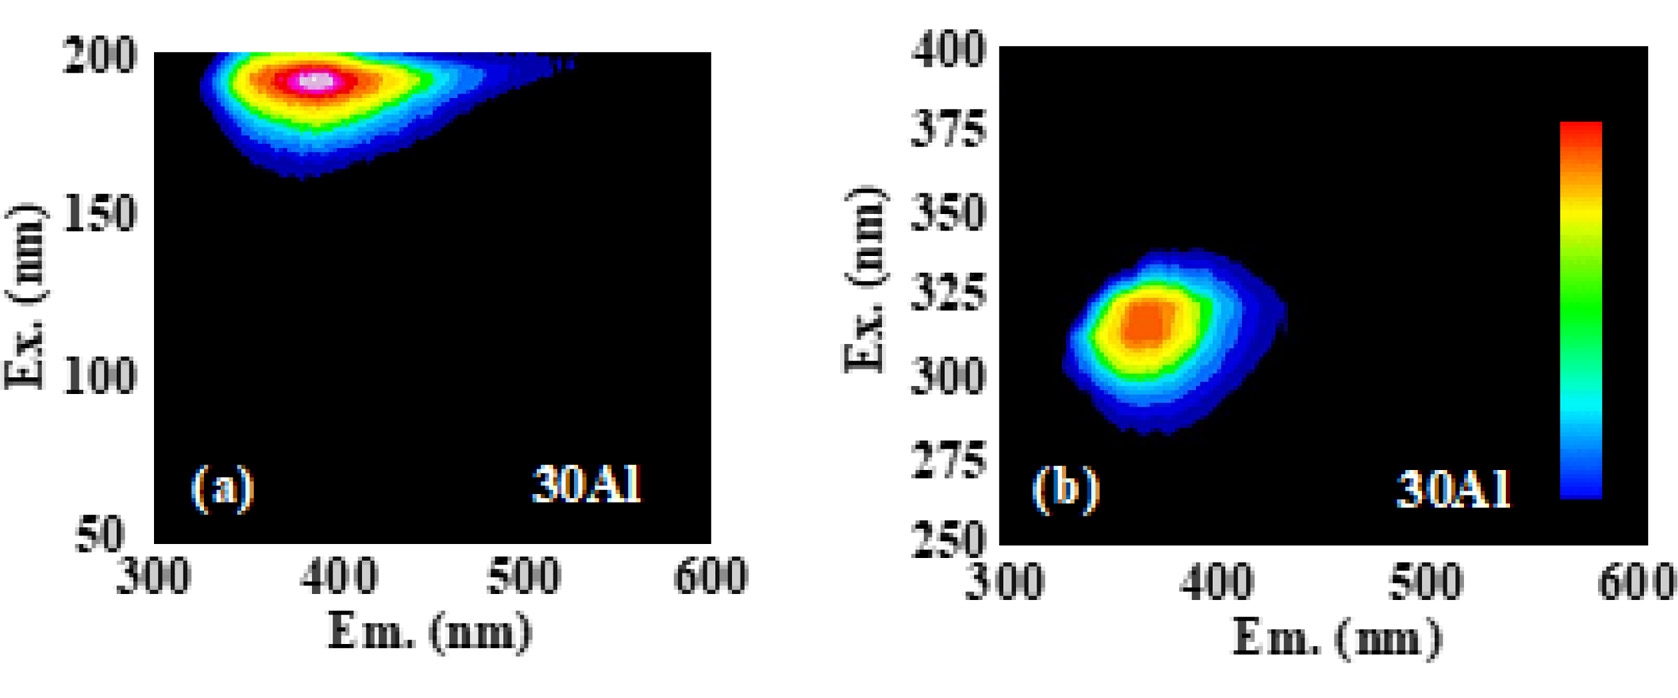
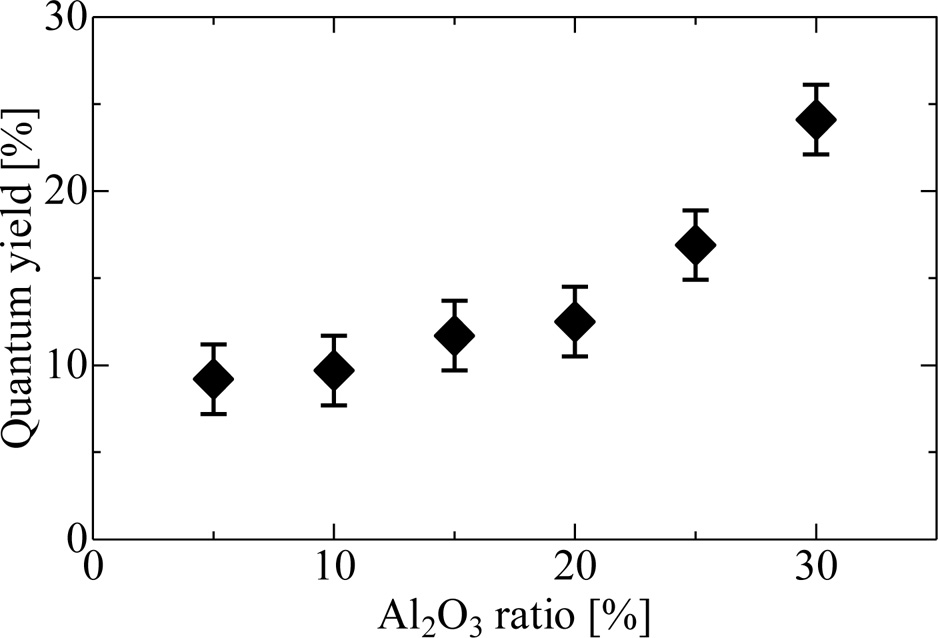
Fig. 5(a) and (b) represent PL excitation/emission contour graph of 30Al as a representative in VUV and UV-VIS ranges, respectively. The spectrum of the sample 30Al shows intense emission from 350 to 500 under excitation at 180 nm and 350-420 nm under excitation at 310 nm. The excitation at 180 nm would be ascribed to the band gap of this host, and that corresponded to 300-340 nm were attributed to 4f-5d excitation of Ce3+ which coincided with the absorption bands observed in the transmittance. All the samples had a similar spectra shape, although the composition of the host differed. When the samples were excited by the wavelength of 310 nm, samples showed an intense emission peaking around 360 nm, and we evaluated the QYs in this condition. As a result, the QYs were 9-24% depending on the composition, and the sample 30Al exhibited the highest QY among the present samples. Fig. 6 summarizes the relationship between the Al ratio and PL-QY. As the Al content increased, PL-QY also increased. It would be due to the change of Ce4+ in the glass to Ce3+ by the increase of the amount of Al2O3.
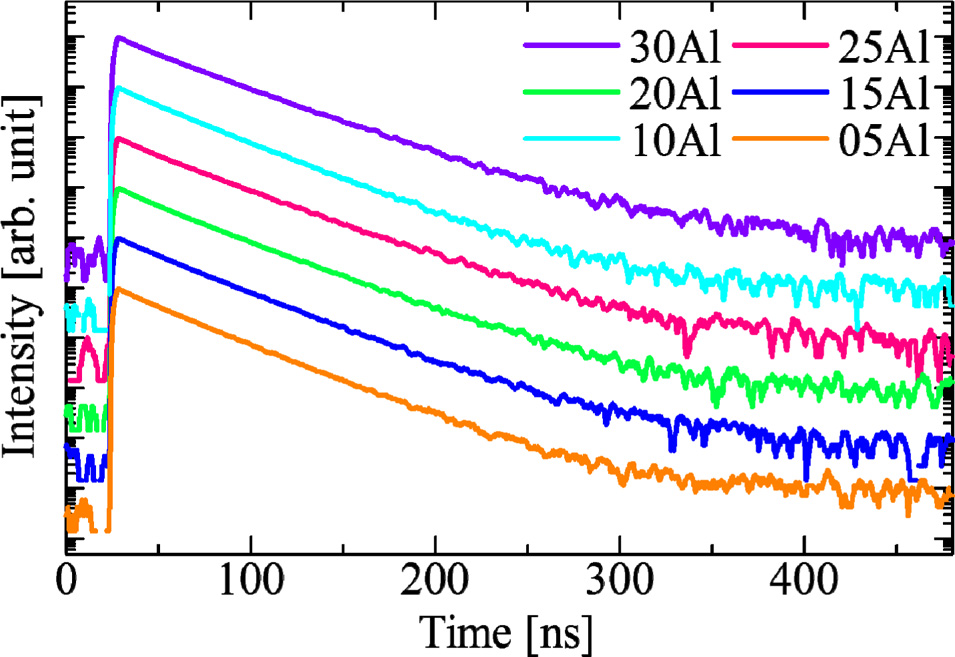
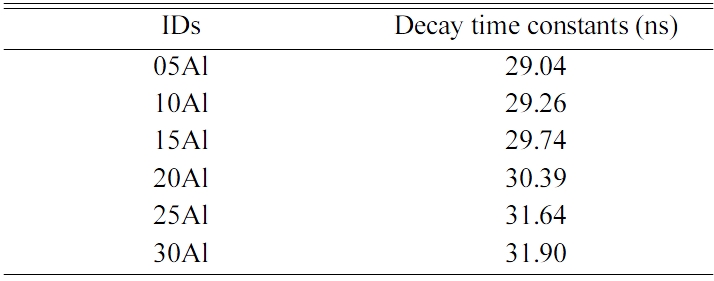
Fig. 7 exemplifies PL decay curves of all the samples. The decay curves of the samples were approximated by single exponential decay function. Table 2 summarize the approximated PL decay lifetimes of the Ce-doped glasses from measured the decay curves. The deduced decay lifetime constant was approximately 30 ns in all the samples. From the typical decay lifetime of Ce3+ reported up to now, the origin of the observed decay lifetimes is considered as the 5d-4f transitions of Ce3+ [23]. The tendency of QY and PL decay lifetimes constants roughly matched up that the fastest sample had the highest PL-QY. In order to consider this phenomenon further, we calculated the radiative and non-radiative transition rates denoted as kr and knr, respectively. The observed PL decay lifetime τ can be expressed by the equation of τ = 1/(kr + knr). In addition, a PL-QY is expressed as QY = kr /(kr + knr). From these relationships, the transition rates can be obtained by the following equation.
kr = QY/τ
knr = (1 - QY)/τ
As an example, 5Al sample had kr and knr as 3.10 × 10⁶ s-1 and 3.13 × 10⁷ s-1, respectively. On the other hand, the radiative transition and non-radiative transition rates of 30 Al are 7.52 × 10⁶ s-1 and 2.38 × 10⁷ s-1, respectively. The radiative transition rate increased in proportional to Al ratio, and the non-radiative transition ratio showed the opposite tendency. Thus, we can consider the higher QY of Al-rich samples are ascribed to the suppression of the non-radiative transition probability.
|
Fig. 3 Fig. 3. Optical in-line transmittance spectra of prepared glass samples. The inset expands the shorter wavelength range. |
|
Fig. 4 Fig. 4. Glass forming region of K2O-Al2O3-P2O5 ternary glass system from INTERGLAD Ver. 7 [22]. |
|
Fig. 5 Fig. 5. PL excitation/emission contour graphs of the 30Al sample. (a) and (b) are measured under the condition that the excitation wavelengths were 50−200 and 250−400 nm, respectively. The vertical and horizontal axes represent the excitation and emission wavelengths, respectively. |
|
Fig. 6 Fig. 6. PL-QY of Ce-doped (100-x)KPO3-xAl2O3 glasses plotted as a function of Al2O3 ratio. |
|
Fig. 7 Fig. 7. PL decay profiles of Ce-doped (100-x)KPO3-xAl2O3 glasses. |
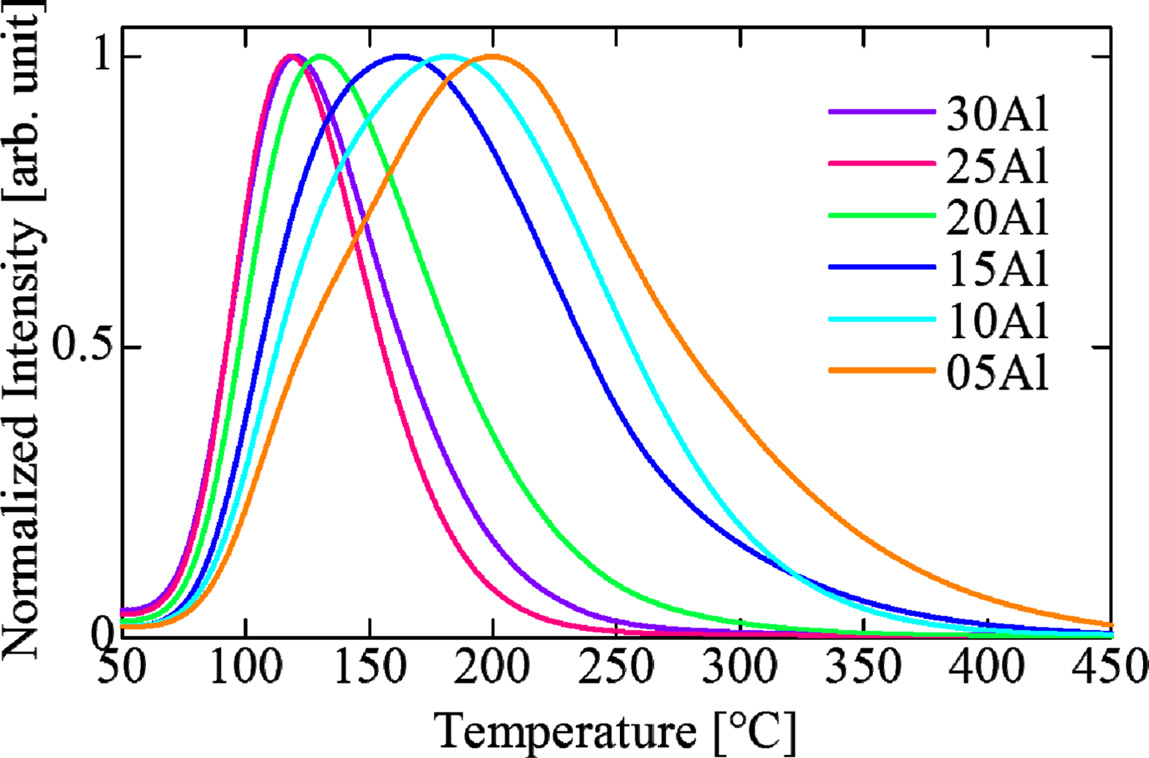
Fig. 8 depicts TSL glow curves of all the samples after 10 Gy X-ray irradiation. In the overall tendency, the measured TSL grow curves showed peak shifts to the low temperature side along with an increase of the Al2O3 ratio. We think this is because aluminum ions compensated for defects in the glass by increasing of Al2O3 ratio. As a result, the deep traps disappeared, and we could observe only shallow traps.
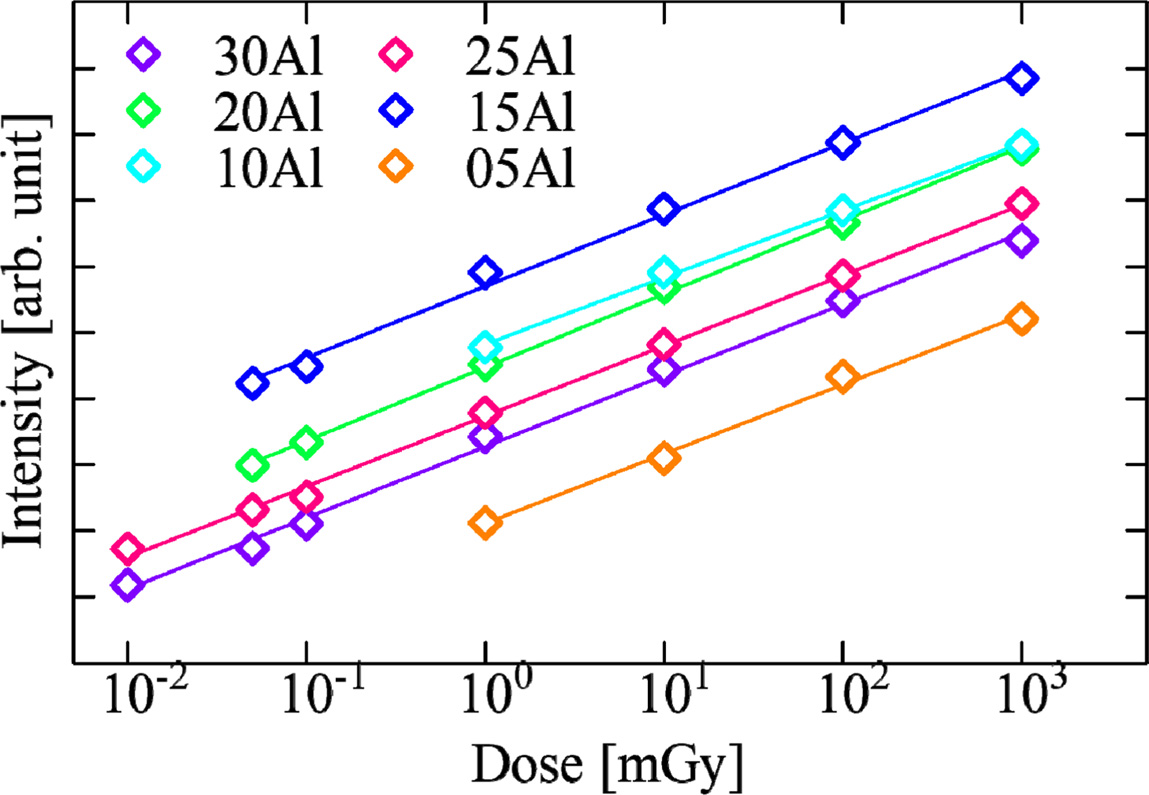
From the integration of TSL glow curves, we evaluated the characteristic of dose response. The dose response function of all the samples are shown in Fig. 9. The samples of 25Al and 30Al exhibited the best linearity and sensitivity in the range of 0.01-1000 mGy. The lower detection limit of these glasses was the comparable level with some commercial dosimeters [24]. Compared with the cases of the other phosphate glasses containing Li and Na as an alkali metal, the prepared glasses were improved on the sensitivity for radiation.
|
Fig. 8 Fig. 8. TSL grow curves of Ce-doped (100-x)KPO3-xAl2O3 glasses after 10 Gy irradiations. |
|
Fig. 9 Fig. 9. TSL response as a function of X-ray dose for Ce-doped (100-x)KPO3-xAl2O3 glasses. |
A broad emission peak 300-500 nm was detected, and the emission wavelength was close to that of PL excitation/emission contour graph. Therefore, the origin of scintillation is also due to Ce3+. The scintillation intensity increased to depend on the amount of Al2O3. This tendency was similar to that of QY. In the conventional Robbins model, the scintillation light yield is roughly expressed as the product of the energy migration efficiency from the host to emission center and QY. Thus, we can consider that the present samples have a similar energy migration efficiency, and it would be reasonable because the composition of the host are similar (only Al ratio differs) and the number of emission center which is a goal of the energy migration is fixed.
The Ce 0.1% doped K2O-Al2O3-P2O5 glass samples with different ratios of Al2O3 were synthesized by the melt quenching method. When we increased Al ratio, the maximum ratio was Al = 30, and we could not obtain a glass sample in Al = 40. The synthesized samples were evaluated on the optical, PL, dosimeter and scintillation properties. Among the present samples, the 30Al sample showed the best properties on QY, scintillation intensity and the best linearity and sensitivity as a TSL dosimeter.
This work was supported by Grant-in-Aid for Scientific Research (A) (17H01375) and (B) (18H03468) from the Ministry of Education, Culture, Sports, Science and Technology of the Japanese government (MEXT), A-STEP from Japan Science and Technology Agency (JST). The Cooperative Research Project of Research Institute of Electronics, Shizuoka University, Terumo Foundation for Life Sciences and Arts, Izumi Science and Technology Foundation, The Kazuchika Okura Memorial Foundation, and The Iwatani Naoji Foundation are also acknowledged.
- 1. T. Yanagida, A. Yoshikawa, Y. Yokota, K. Kamada, Y. Usuki, S. Yamamoto, M. Miyake, M. Baba, K. Kumagai, K. Sasaki, M. Ito, N. Abe, Y. Fujimoto, S. Maeo, Y. Furuya, H. Tanaka, A. Fukabori, T. Rodrigues dos Santos, M. Takeda, and N. Ohuchi, IEEE Trans. Nucl. Sci. 57 (2010) 1492-1495.
-

- 2. D. Totsuka, T. Yanagida, K. Fukuda, N. Kawaguchi, Y. Fujimoto, J. Pejchal, Y. Yokota, and A. Yoshikawa, Nucl. Instruments Methods Phys. Res. Sect. A Accel. Spectrometers, Detect. Assoc. Equip. 659 (2011) 399-402.
-

- 3. S. Moriuchi, M. Tsutsumi, and K. Saito, Japanese J. Heal. Phys. 44 (2009) 122-133.
-

- 4. Y. Miyamoto, T. Ohno, Y. Takei, H. Nanto, T. Kurobori, T. Yanagida, A. Yoshikawa, Y. Nagashima, and T. Yamamoto, Radiat. Meas. 55 (2013) 72-74.
-

- 5. T. Yanagida, Y. Fujimoto, S. Kurosawa, K. Kamada, H. Takahashi, Y. Fukazawa, M. Nikl, and V. Chani, Jpn. J. Appl. Phys. 52 (2013) 076401.
-

- 6. T. Itoh, M. Kokubun, T. Takashima, T. Honda, K. Makishima, T. Tanaka, T. Yanagida, S. Hirakuri, R. Miyawaki, H. Takahashi, K. Nakazawa, and T. Takahashi, IEEE Trans. Nucl. Sci. 53 (2006) 2983-2990.
-

- 7. K. Yamaoka, M. Ohno, Y. Terada, S. Hong, J. Kotoku, Y. Okada, A. Tsutsui, Y. Endo, K. Abe, Y. Fukazawa, S. Hirakuri, T. Hiruta, K. Itoh, T. Itoh, T. Kamae, M. Kawaharada, N. Kawano, K. Kawashima, T. Kishishita, T. Kitaguchi, M. Kokubun, G.M. Madejski, K. Makishima, T. Mitani, R. Miyawaki, T. Murakami, M.M. Murashima, K. Nakazawa, H. Niko, M. Nomachi, K. Oonuki, G. Sato, M. Suzuki, H. Takahashi, I. Takahashi, T. Takahashi, S. Takeda, K. Tamura, T. Tanaka, M. Tashiro, S. Watanabe, T. Yanagida, and D. Yonetoku, IEEE Trans. Nucl. Sci. 52 (2005) 2765-2772.
-

- 8. T. Yanagida, Opt. Mater. 35 (2013) 1987-1992.
-

- 9. S.W.S. McKeever, Radiat. Meas. 46 (2011) 1336-1341.
-

- 10. Takayuki Yanagida, 94 (2018) 75-97.
-

- 11. Y. Miyamoto, T. Yamamoto, K. Kinoshita, S. Koyama, Y. Takei, H. Nanto, Y. Shimotsuma, M. Sakakura, K. Miura, and K. Hirao, Radiat. Meas. 45 (2010) 546-549.
-

- 12. A.B. Corradi, V. Cannillo, M. Montorsi, and C. Siligardi, J. Mater. Sci. 41 (2006) 2811-2819.
-

- 13. S. Tanabe, S. Yoshii, K. Hirao, and N. Soga, Am. Phys. Soc. 45 (1992) 4620-4625.
-

- 14. T. Kuro, G. Okada, N. Kawaguchi, Y. Fujimoto, H. Masai, and T. Yanagida, Opt. Mater. 62 (2016) 561-568.
-

- 15. H. Tatsumi, G. Okada, T. Yanagida, and H. Masai, J. Ceram. Soc. Japan. 124 (2016) 550-553.
-

- 16. D. Shiratori, Y. Isokawa, H. Samizo, G. Okada, N. Kawaguchi, and T. Yanagida, to be submitted to J. Mater. Sci. Mater. Electron.
-

- 17. A. Moguš-Milanković, A. Gajović, A. Šantić, and D.. Day, J. Non. Cryst. Solids. 289 (2001) 204-213.
-

- 18. S. Kaur, G.P. Singh, P. Kaur, and D.P. Singh, 143 (2013) 31-37.
-

- 19. R. Reisfeld, H. Minti, A. Patra, D. Ganguli, and M. Gaft, Spectrochim. Acta Part A Mol. Biomol. Spectrosc. 54 (1998) 2143-2150.
-

- 20. T. Yanagida, Y. Fujimoto, N. Kawaguchi, and S. Yanagida, J. Ceram. Soc. Japan. 121 (2013) 988-991.
-

- 21. T. Yanagida, K. Kamada, Y. Fujimoto, H. Yagi, and T. Yanagitani, Opt. Mater. 35 (2013) 2480-2485.
-

- 22. International Glass Database System INTERGLAD Ver. 7 released by New Glass Forum
- 23. Y. Isokawa, S. Hirano, N. Kawano, G. Okada, N. Kawaguchi, and T. Yanagida, J. Non. Cryst. Solids. 487 (2018) 1-6.
-

- 24. CHIYODA TECHNOL Corp. (n.d.). Retrieved Nov. 12, (2018), from http://www.c-technol.co.jp/radiation_monitoring/ monitoring02.
 This Article
-
2019; 20(4): 301-306
Published on Aug 31, 2019
- Received on Nov 15, 2018
- Revised on Feb 6, 2019
- Accepted on May 9, 2019
 Services
- Abstract
introduction
experimental procedure
results and discussions
summary and conclusions
- Acknowledgements
- References
- Full Text PDF
Shared
 Correspondence to
- D. Shiratori
-
Devision of Materials Science, Nara Institute of Science and Technology, 8916-5 Takayama-cho, Ikoma, Nara 630-0101, Japan
Tel : +81-743-72-6144
Fax: +82-743-72-6147 - E-mail: shiratori.daiki.sc3@ms.naist.jp


 Copyright 2019 International Orgranization for Ceramic Processing. All rights reserved.